
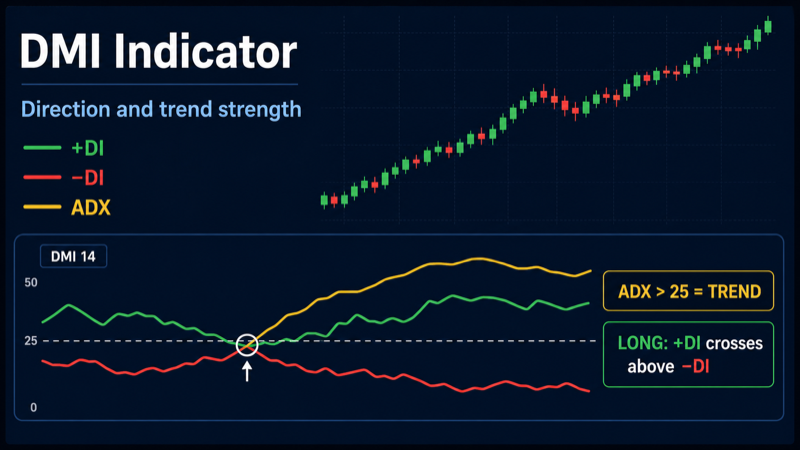
The Start Bots Signal category describes signals and indicators that can start a trading bot. One of the technical indicators is DMI (Directional Movement Index).
When creating or editing any bot, there is a Start signal builder block at the bottom of settings. You can choose individual indicators, ready-made presets, and their combinations. Conditions are grouped: AND inside a group, OR between groups. The same indicator can be configured in different ways - for Long and Short, for breakouts and bounces, for level comparisons and for crosses.
What is DMI (Directional Movement Index)
DMI (Directional Movement Index) is a trend indicator developed by Welles Wilder. It consists of three lines: +DI (Positive Directional Indicator, bullish direction), −DI (Negative Directional Indicator, bearish direction), and ADX (Average Directional Index). DMI answers two questions: which way the market is moving and how strongly the trend is expressed.
A +DI/−DI cross is the classic dominance shift signal: when +DI crosses above −DI, bulls take control; when −DI crosses above +DI, bears do. But the cross alone does not measure trend strength - in ranges the lines whipsaw. That is what ADX is for: it measures trend intensity regardless of direction. ADX rises when +DI and −DI diverge; it falls when the market calms down.
In the ELIXOAI start signal builder, DMI is used as an automatic bot start condition: the dmi_cross preset catches +DI crossing −DI, the dmi_adx_strength preset fires when ADX exceeds 25 (trend strong enough to trade). Both presets can be combined with EMA, RSI, or higher-timeframe filters.
DMI vs MACD and EMA
All three tools relate to trend, but solve different problems:
- MACD is built on the difference between two EMAs and shows momentum through line or zero crosses. MACD has no separate “trend strength” metric - only direction and acceleration. DMI explicitly separates direction (+DI vs −DI) and strength (ADX).
- EMA is a price moving average; price position vs EMA shows trend but not strength. DMI +DI/−DI crosses give earlier momentum shift signals; ADX filters weak moves in chop.
- DMI is the only one of the three that gives a numeric trend strength reading via ADX. Classic thresholds: ADX < 20 - weak trend or range; 20–25 - trend forming; > 25 - trend strong enough to trade; > 40–50 - very strong trend (watch for reversals).
How DMI works
DMI is calculated from True Range and directional movement over a period (default 14 candles):
- +DI (pdi) - upward movement strength. The higher +DI vs −DI, the more buyers dominate.
- −DI (mdi) - downward movement strength. When −DI is above +DI, bears control the market.
- ADX (adx) - smoothed measure of divergence between +DI and −DI. ADX does not show direction - it can rise in both rallies and selloffs. High ADX means the trend is strong, Long or Short.
In the builder you set a comparison condition on one output: “+DI crosses above −DI,” “ADX greater than 25,” “+DI greater than −DI,” and so on. The system fetches live DMI values from the exchange via TAAPI and checks the condition on your timeframe - at candle close or every minute.
Three DMI outputs
The builder exposes three numeric outputs for the dmi indicator:
- pdi (+DI): positive directional indicator. Used as the main line in dmi_cross - pdi crossing mdi.
- mdi (−DI): negative directional indicator. In dmi_cross it is the cross target: pdi cross up mdi.
- adx (ADX): trend strength index. Used in dmi_adx_strength - ADX > 25 as a “trend strong enough” filter. Any threshold works: gt 20, gt 30, gte 25.
Period parameter
- Range: 1 to 300.
- Default: 14 - Wilder’s classic setting; balanced for 15m–4h.
- Short period (7–10): DMI reacts faster, more +DI/−DI crosses, more false signals in ranges. Useful on 5m–15m for scalping with a mandatory ADX filter.
- Long period (20–28): smoother DMI, less frequent dominance changes. Better for 1h–4h swing - fewer but more sustained trend signals.
DMI(14) on 15m and DMI(14) on 4h are different indicators. When changing timeframe, revisit period and preset mix (cross vs adx_strength).
Ready-made presets in the builder
The builder offers two DMI presets with default settings. Each can be fully customized: different operator, output, threshold, or timeframe.
dmi_cross - +DI crosses above −DI (Long)
Default condition: pdi (+DI) crosses mdi (−DI) from below to above (cross up) on the selected timeframe (15m interval, period 14, check at bar close).
Classic DMI Long signal: bullish direction begins to dominate bearish. Unlike “pdi > mdi,” the cross captures the transition moment, not just current position. For Short, set operator “crosses below” - pdi cross down mdi.
dmi_adx_strength - ADX > 25 (strong trend)
Default condition: ADX greater than 25 (gt) on the selected timeframe (15m interval, period 14, check at bar close).
Trend strength filter: the bot starts when the market leaves chop and the trend becomes strong enough. ADX > 25 alone gives no direction - combine with dmi_cross, EMA, or price above/below a key average. For Short context, add mdi > pdi in the same group.
Available operators- Crosses above (cross up): Output was below the target and moved above. For dmi_cross: pdi cross up mdi - Long. Custom: adx cross up 25 - ADX just exceeded the strength threshold.
- Crosses below (cross down): Output was above the target and dropped below. pdi cross down mdi - Short. adx cross down 25 - trend weakening, exit from strong move.
- Greater than (gt): Value strictly above threshold. ADX gt 25 - strong trend right now. pdi gt mdi - bulls dominate without requiring a fresh cross.
- Less than (lt): Value strictly below threshold. ADX lt 20 - weak trend, range. mdi gt pdi (or pdi lt mdi) - bears dominate.
- Greater or equal (gte): Value at or above threshold. ADX gte 25 on 4h - sustained higher-TF trend as a filter.
- Less or equal (lte): Value at or below threshold. ADX lte 20 - market in range, DMI crosses unreliable.
ADX is the key to filtering DMI noise. ADX < 20 - weak or no trend; +DI/−DI crosses are often false. ADX 20–25 - trend forming. ADX > 25 - trend strong enough to trade (dmi_adx_strength preset threshold). ADX > 40–50 - extremely strong trend; sharp corrections possible. ADX shows strength, not direction - for Long check pdi > mdi, for Short mdi > pdi.
General builder settings
- Timeframe (interval): 1m, 5m, 15m, 30m, 1h, 4h, 1d. Shorter intervals give more signals but more noise. Swing bots often use 1h–4h; scalping uses 5m–15m.
- Check mode: At candle close checks after the candle closes - fewer false triggers. Every minute checks inside the current candle - faster reaction, higher false-start risk.
- Operator: greater than, less than, crosses above, crosses below, greater or equal, and others define how the indicator value is compared to the target.
- Target value: a number (e.g. 30 for RSI), an indicator line (e.g. %D for Stochastic), or price (for Bollinger Bands).
- Condition groups: up to 3 groups with up to 5 conditions each. Example: group 1 - RSI < 30 AND price < lower band; group 2 - Stochastic < 20. The bot starts if group 1 OR group 2 is satisfied.
Setup examples for different strategies
Classic Long: dmi_cross
Goal: bot start on dominance shifting to bulls.
Long: dmi_cross preset, pdi cross up mdi, 15m timeframe, period 14, check at bar close.
Short: pdi cross down mdi, same settings.
Basic DMI strategy without extra filters - more signals, higher false-cross risk in ranges.
Short on −DI cross
Condition: mdi cross up pdi (equivalent to pdi cross down mdi), period 14, 15m, check at close.
Filter: ADX gt 20 in the same group - short only when trend is forming, not in dead chop.
Fits short grids on local uptrend reversals.
DI cross + ADX strength
Group 1: dmi_cross (pdi cross up mdi) on 15m AND dmi_adx_strength (ADX gt 25) on the same 15m.
Logic: Long only when both direction (+DI above −DI) and strength (ADX > 25) confirm. Fewer false starts than pure dmi_cross.
Short: pdi cross down mdi AND ADX gt 25 AND mdi > pdi.
Trend confirmation via EMA
Long: dmi_cross on 15m AND close price above EMA 50 on 1h.
Short: pdi cross down mdi on 15m AND price below EMA 50 on 1h.
EMA shows global direction; DMI catches local momentum shift with the trend.
Scalping: period 10 on 5m–15m
Long: dmi_cross, period 10, 5m timeframe, check at close AND ADX gt 20.
Short: pdi cross down mdi, same settings.
Period 10 speeds up DMI; ADX filter is mandatory - without it 5m whipsaws heavily.
Swing: period 14 on 1h–4h
Long: dmi_cross on 4h, period 14, check at close AND ADX gt 25.
Short: pdi cross down mdi on 4h, ADX gt 25.
Rare but meaningful signals - closer to a “real” trend shift on a higher interval.
Multi-timeframe
Long: ADX gt 25 on 4h (separate condition, dmi_adx_strength) AND dmi_cross on 15m.
Short: ADX gt 25 on 4h AND pdi cross down mdi on 15m.
Higher TF confirms trend strength; lower TF gives entry - avoids buying every local cross against weak global ADX.
DMI + RSI
Long: dmi_cross on 15m AND RSI cross up 30 (or RSI < 40) on the same 15m - DMI direction and RSI bounce aligned.
Short: pdi cross down mdi AND RSI cross down 70.
RSI catches oversold/overbought; DMI confirms directional dominance shift.
Pullback in trend
Group 1: pdi gt mdi on 4h (period 14) AND dmi_cross on 15m.
Logic: higher TF shows sustained bullish dominance (+DI above −DI); lower TF catches resumption after a short correction. Fewer false starts against the global trend.
Strong trend: ADX gt 30
Long: ADX gt 30 on 1h AND pdi gt mdi on 1h - bot starts only in clearly strong trends.
Short: ADX gt 30 AND mdi gt pdi on 1h.
Stricter than 25 - fewer trades, higher quality in trending phases. Downside - later entry vs move start.
DCA on trend resumption
Long: dmi_cross on 1h (period 14) AND ADX gte 20 on 1h AND price > EMA 200 on 4h.
Short: pdi cross down mdi AND ADX gte 20 AND price < EMA 200 on 4h.
For DCA bots on pullbacks: +DI/−DI cross is softer than a hard breakout; EMA 200 sets global context.
Condition groups: practical example
Bot with two Long scenarios:
Group 1: dmi_cross on 15m AND ADX gt 25 on 15m - impulse entry with confirmed strength.
Group 2: ADX gt 25 on 4h AND pdi gt mdi on 15m - higher-TF trend, bullish dominance on lower TF.
Groups combined with OR: either scenario can start the bot. Configure Short symmetrically (pdi cross down mdi, mdi gt pdi).
Tip
DMI cross without an ADX filter in ranges produces many false starts: +DI and −DI constantly cross when ADX < 20. Always combine dmi_cross with dmi_adx_strength (ADX gt 25) or a higher-timeframe EMA filter. Remember: ADX shows strength, not direction - for Long check pdi > mdi, for Short mdi > pdi. Use check at bar close to ignore intrabar noise.