
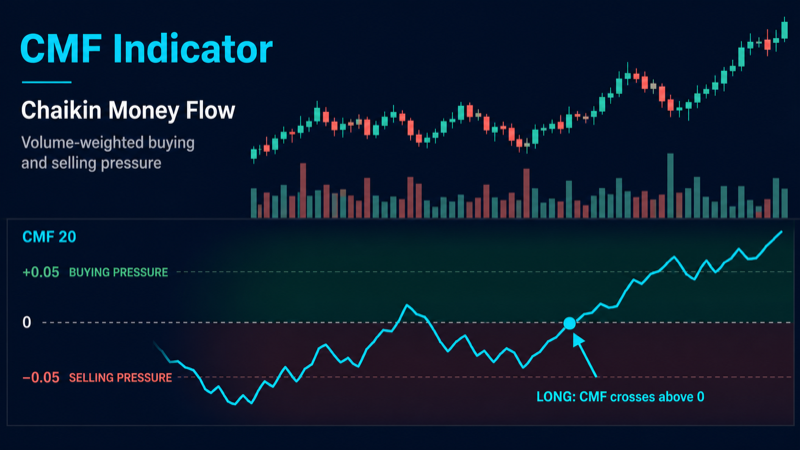
The Start Bots Signal category describes signals and indicators that can start a trading bot. One of the technical indicators is CMF (Chaikin Money Flow).
When creating or editing any bot, there is a Start signal builder block at the bottom of settings. You can choose individual indicators, ready-made presets, and their combinations. Conditions are grouped: AND inside a group, OR between groups. The same indicator can be configured in different ways - for Long and Short, for breakouts and bounces, for level comparisons and for crosses.
What is Chaikin Money Flow
CMF (Chaikin Money Flow) is a volume-based indicator developed by Marc Chaikin from the Accumulation/Distribution concept. Unlike oscillators such as RSI, CMF directly incorporates trading volume: it shows whether candles closed nearer the high (buyers in control) or the low (sellers pressing), and how strongly that impulse is backed by volume.
CMF values typically range from about −1 to +1. The zero line is neutral: above zero, money on average flows into the asset (accumulation); below zero, it flows out (distribution). CMF does not give an entry point by itself, but answers: does volume confirm the current price move? In the ELIXOAI start signal builder, CMF is used as an automatic bot start condition - when money flow crosses a set level or stays above/below a threshold.
CMF works best on liquid pairs where volume reflects real participation. On thin altcoins with irregular volume, signals can be noisier - consider a higher timeframe or combine CMF with a trend filter.
How CMF works: volume pressure
For each candle, the close position within the High–Low range is calculated and multiplied by volume. Over the chosen period, “money volume” is summed and divided by total volume - a normalized pressure reading.
- Money Flow Multiplier = ((Close − Low) − (High − Close)) / (High − Low). A close near the top of the range yields a multiplier near +1; near the bottom, near −1.
- Money Flow Volume = multiplier × candle volume. Heavy volume on a bullish candle adds more positive weight; on a bearish candle, negative weight.
- CMF = sum of Money Flow Volume over N periods ÷ sum of volume over the same N periods. The classic period is 20.
The accumulation/distribution idea: if price rises while CMF stays positive and climbs, buyers are aggressively accumulating. If price rises but CMF falls or turns negative, the move lacks money support and may be weak. The mirror applies to drops: negative CMF confirms seller pressure.
In the builder you set a comparison condition, not the formula: “CMF crosses above 0,” “CMF greater than 0.05,” “CMF less than −0.05,” and so on. The system fetches live CMF from the exchange via TAAPI and checks the condition on your timeframe.
Period parameter
- Range: 2 to 300.
- Default: 20 - Chaikin’s standard setting, balanced for 15m–4h.
- Short period (10–14): reacts faster to pressure shifts, more signals. Useful for 5m–15m scalping if you filter noise.
- Long period (30–50): smoother CMF, fewer extreme crosses. Better for 1h–4h swing - fewer but more sustained flow signals.
CMF(20) on 15m and CMF(20) on 4h are different indicators. When changing timeframe, revisit both period and thresholds (0, ±0.05).
Ready-made presets in the builder
The builder offers one CMF preset with default settings. You can fully customize it: different operator, level, period, or timeframe.
CMF cross_up 0 - positive money flow (cmf)
Default condition: CMF crosses level 0 from below to above (cross up) on the selected timeframe (15m interval, period 20, check at bar close).
A Long signal on money flow turning positive: sellers stop dominating, buyers begin accumulating. Unlike plain “CMF > 0,” the cross captures the transition moment - flow was negative or neutral and became positive. For Short, set operator “crosses below” and target 0, or use level −0.05.
Available operators- Crosses above (cross up): CMF was below the level and moved above. Classic Long setup - cross up 0: start of positive flow.
- Crosses below (cross down): CMF was above the level and dropped below. Short signal - cross down 0: flow turned negative.
- Greater than (gt): CMF is strictly above the level right now. E.g. CMF > 0.05 - sustained buyer pressure without requiring a cross.
- Less than (lt): CMF is strictly below the level. CMF < −0.05 - clear distribution and seller pressure.
- Greater or equal (gte): CMF at or above the threshold. Handy for “CMF ≥ 0” filter on a higher timeframe.
- Less or equal (lte): CMF at or below the threshold. Bearish context filter: CMF ≤ 0 on 4h.
- 0 - neutral line; cross up - inflow, cross down - outflow. Main reference for a shift in control.
- +0.05 - moderate accumulation; buyers clearly control flow. Good for trend confirmation and Long filters.
- −0.05 - moderate distribution; sellers press. Threshold for Short or anti-Long filter.
On crypto markets, values rarely reach ±0.25 - ±0.05 is already meaningful. For aggressive entries use cross up 0; for conservative, gt 0.05 after the cross.
General builder settings
- Timeframe (interval): 1m, 5m, 15m, 30m, 1h, 4h, 1d. Shorter intervals give more signals but more noise. Swing bots often use 1h–4h; scalping uses 5m–15m.
- Check mode: At candle close checks after the candle closes - fewer false triggers. Every minute checks inside the current candle - faster reaction, higher false-start risk.
- Operator: greater than, less than, crosses above, crosses below, greater or equal, and others define how the indicator value is compared to the target.
- Target value: a number (e.g. 30 for RSI), an indicator line (e.g. %D for Stochastic), or price (for Bollinger Bands).
- Condition groups: up to 3 groups with up to 5 conditions each. Example: group 1 - RSI < 30 AND price < lower band; group 2 - Stochastic < 20. The bot starts if group 1 OR group 2 is satisfied.
Setup examples for different strategies
Scalping on 5m–15m
Goal: quick starts on money flow shifts.
Long: cmf preset, cross up 0, 5m or 15m timeframe, period 14, check at bar close.
Short: cross down 0, same settings.
Filter: add CMF on 1h ≥ 0 for Long - scalp only with higher-timeframe flow.
Swing on 1h–4h
Goal: fewer but sustained flow signals.
Long: CMF > 0.05 on 4h, period 20, check at close - bot starts when accumulation is already confirmed.
Short: CMF < −0.05 on 4h.
For trend pullbacks, cross up 0 on 1h with period 20 often works better - catch flow resuming after a correction.
Trend confirmation
Goal: Long only when volume supports the rise.
Group 1: CMF cross up 0 on 15m AND close price above EMA 50 on the same 15m.
Short: CMF cross down 0 AND price below EMA 50.
Price shows direction; CMF confirms the move is backed by money, not empty momentum.
Divergence concept
Bullish divergence: price makes a lower low while CMF forms a higher low - selling not confirmed by volume, possible reversal up. Set cross up 0 on 1h after such a pattern, or add RSI < 35 as extra filter.
Bearish divergence: price higher, CMF lower - rise without inflow. Short: cross down 0 or CMF < −0.05 on 15m.
The builder does not detect divergences automatically - use crosses and levels as proxies for flow change.
CMF + price and EMA
Long: price cross up EMA 20 on 15m AND CMF cross up 0 on the same 15m - double confirmation: price and volume turned up together.
Short: price cross down EMA 20 AND CMF cross down 0.
Alternative: CMF > 0.05 AND price > EMA 50 on 1h - trend Long on sustained accumulation.
Short on distribution
Condition: CMF cross down 0 or CMF < −0.05, period 20, 15m, check at close.
Filter: RSI > 65 in the same group - short after overbought with outflow confirmation.
Fits short grids at local peaks when price is still high but money is leaving.
Strong accumulation (higher-TF filter)
Group 1: CMF on 4h greater than 0.05 (period 20) AND CMF cross up 0 on 15m.
Logic: higher timeframe shows sustained accumulation; lower TF catches flow resuming after a pullback. Fewer false starts in chop.
CMF + RSI
Long: RSI cross up 30 on 15m AND CMF cross up 0 on 15m - momentum and volume aligned.
Short: RSI cross down 70 AND CMF cross down 0.
RSI catches oversold/overbought; CMF checks that real money backs the move.
Multi-timeframe
Long: CMF on 4h ≥ 0 (separate condition, gte, period 20) AND CMF cross up 0 on 15m.
Short: CMF 4h ≤ 0 AND CMF cross down 0 on 15m.
Avoids buying every local CMF spike against global outflow on the higher interval.
Condition groups: practical example
Bot with two Long scenarios:
Group 1: CMF cross up 0 on 15m AND price > EMA 50 - trend accumulation.
Group 2: CMF > 0.05 on 1h AND RSI < 40 on 15m - bounce from oversold with confirmed inflow.
Groups use OR logic: either scenario can start the bot. Configure Short symmetrically (cross down 0, CMF < −0.05).
Tip
CMF reacts to volume: on news spikes and abnormal candles the reading can jump and produce a false cross. Use check at bar close and a higher-timeframe filter. If price rises but CMF stays below zero for long - do not rely on price signals alone; wait for cross up 0 or gt 0.05. In a strong downtrend, cross up 0 is often brief - combine with EMA or CMF on 4h ≥ 0.