
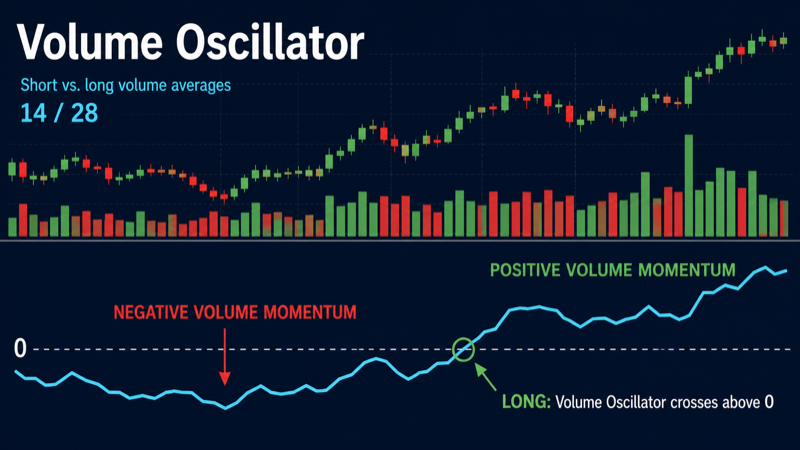
The Start Bots Signal category describes signals and indicators that can start a trading bot. One of the technical indicators is Volume Oscillator.
When creating or editing any bot, there is a Start signal builder block at the bottom of settings. You can choose individual indicators, ready-made presets, and their combinations. Conditions are grouped: AND inside a group, OR between groups. The same indicator can be configured in different ways - for Long and Short, for breakouts and bounces, for level comparisons and for crosses.
What is Volume Oscillator
Volume Oscillator (VOSC) compares two volume moving averages: a short (fast) and a long (slow) SMA. The gap between them shows whether current trading activity is expanding or contracting relative to recent history. A positive value means short-term volume exceeds the long-term average - participant interest is picking up.
Unlike the raw volume histogram on a chart, VOSC normalizes data through the ratio of two SMAs and produces an oscillating line around zero. The zero line is the key reference: above zero, short-term volume beats the long-term average (activity expanding); below zero, volume is below average (contraction, quiet market). In the ELIXOAI start signal builder, Volume Oscillator is used as an automatic bot start condition - when the oscillator crosses zero or stays above/below a threshold.
VOSC does not show price direction directly - it answers: is the move backed by rising volume? A sharp price rise on falling VOSC often signals weak impulse; a level breakout with cross up 0 on volume is a more reliable setup. That is why the indicator is almost always combined with price filters (EMA, breakouts, RSI).
Volume Oscillator vs OBV, CMF, and raw volume
All these tools relate to volume, but measure different aspects:
- OBV (On Balance Volume) accumulates volume cumulatively: volume adds on up closes and subtracts on down closes. OBV shows overall volume flow over time and is good for divergences, but does not directly compare “fast” vs “slow” volume.
- CMF (Chaikin Money Flow) weights volume by where the candle closed within its range (near high or low). CMF answers “where is money flowing,” while VOSC answers “is trading volume itself accelerating or fading.”
- Raw volume on the chart is absolute - hard to compare across periods and assets. VOSC turns volume into a relative oscillator: the short SMA reacts to fresh spikes, the long SMA sets the baseline of “normal” activity.
How Volume Oscillator works
The calculation uses two volume SMAs - short and long:
VOSC = ((Short Volume SMA − Long Volume SMA) / Long Volume SMA) × 100, where Short Volume SMA is the average volume over short_period candles and Long Volume SMA over long_period candles.
- VOSC > 0 - short-term volume exceeds the long-term average; participant activity is expanding, often on breakouts and impulse moves.
- VOSC < 0 - short-term volume is below the long-term average; trading activity is contracting, consolidation or fading interest.
- VOSC = 0 - short and long volume SMAs match; neutral activity balance, equilibrium point.
In the builder you set a comparison condition for the value output: “Volume Oscillator crosses above 0,” “VOSC greater than 0,” “VOSC less than 0,” and so on. The system fetches live VOSC via TAAPI and checks the condition on your timeframe - at candle close or every minute.
short_period and long_period parameters
- short_period (short volume SMA): 1 to 300.
- Default: 5 - fast line, sensitive to fresh volume spikes on 5m–15m.
- long_period (long volume SMA): 2 to 500; must be greater than short_period.
- Default: 10 - baseline “normal” volume; classic 5/10 pair for 15m.
The smaller short_period is relative to long_period, the sharper VOSC reacts. Pair 3/12 on 5m for scalping; 10/30 on 4h for swing. When changing timeframe, revisit both periods: VOSC(5/10) on 5m and on 1h are different signals.
Ready-made presets in the builder
The builder offers a Volume Oscillator preset with default settings. Fully customizable: different operator, level, periods, or timeframe.
Volume Oscillator cross_up 0 - rising volume activity (vosc)
Default condition: Volume Oscillator (value) crosses level 0 from below to above (cross up) on the selected timeframe (15m interval, short_period 5, long_period 10, check at bar close).
A Long signal on strengthening volume impulse: short-term volume exceeded the long-term average - participant activity is rising. Unlike “VOSC > 0,” the cross captures the transition moment, not just current position above zero. For Short, set operator “crosses below” and target 0.
Available operators- Crosses above (cross up): VOSC was below the level and moved above. Classic Long setup - cross up 0: start of expanding volume activity.
- Crosses below (cross down): VOSC was above the level and dropped below. Short signal - cross down 0: volume activity contracting.
- Greater than (gt): VOSC is strictly above the level right now. E.g. VOSC > 0 - sustained short-term volume above average.
- Less than (lt): VOSC is strictly below the level. VOSC < 0 - clear volume contraction, useful for Short filters.
- Greater or equal (gte): VOSC is at or above the threshold. Handy for “VOSC ≥ 0” filter on a higher timeframe.
- Less or equal (lte): VOSC is at or below the threshold. Volume contraction filter: VOSC ≤ 0 on 4h.
Zero is VOSC’s main reference: cross up 0 means the short volume SMA exceeded the long SMA; cross down 0 means the opposite. In high-volume trends VOSC can stay above zero for a long time - then gt/lt gives earlier entry while cross gives a more precise volume impulse shift.
General builder settings
- Timeframe (interval): 1m, 5m, 15m, 30m, 1h, 4h, 1d. Shorter intervals give more signals but more noise. Swing bots often use 1h–4h; scalping uses 5m–15m.
- Check mode: At candle close checks after the candle closes - fewer false triggers. Every minute checks inside the current candle - faster reaction, higher false-start risk.
- Operator: greater than, less than, crosses above, crosses below, greater or equal, and others define how the indicator value is compared to the target.
- Target value: a number (e.g. 30 for RSI), an indicator line (e.g. %D for Stochastic), or price (for Bollinger Bands).
- Condition groups: up to 3 groups with up to 5 conditions each. Example: group 1 - RSI < 30 AND price < lower band; group 2 - Stochastic < 20. The bot starts if group 1 OR group 2 is satisfied.
Setup examples for different strategies
Scalping: short 3 / long 8 on 5m–15m
Goal: frequent starts on volume spikes.
Long: vosc preset, cross up 0, 5m timeframe, short_period 3, long_period 8, check at bar close.
Short: cross down 0, same settings.
Filter: price above EMA 20 on the same 5m - fewer false crosses in a low-volume range.
Swing: short 5 / long 20 on 1h–4h
Goal: fewer but more meaningful volume shifts.
Long: VOSC cross up 0 on 4h, short_period 5, long_period 20, check at close.
Short: cross down 0 on 4h, same periods.
Long SMA smooths noise and signals closer to a “real” change in asset interest.
Trend confirmation
Goal: Long only when volume and trend align.
Group 1: VOSC cross up 0 on 15m AND close price above EMA 50 on the same 15m.
Short: VOSC cross down 0 AND price below EMA 50.
EMA shows direction; VOSC confirms the move is backed by rising activity.
Breakout
Goal: start the bot on a breakout with volume confirmation.
Long: VOSC gt 0 on 15m (5/10) AND price cross up upper Bollinger Band (20, 2) on the same interval.
Short: VOSC lt 0 AND price below lower BBands.
VOSC gt 0 confirms the breakout comes with expanding volume, not a random spike.
Volume Oscillator + EMA
Long: price cross up EMA 20 on 15m AND VOSC cross up 0 on the same 15m - double confirmation: both price and volume activity turned up.
Short: price cross down EMA 20 AND VOSC cross down 0.
Alternative: VOSC gt 0 AND price > EMA 50 on 1h - trend Long on sustained volume impulse.
Short on volume contraction
Condition: VOSC cross down 0 or VOSC < 0, short 5 / long 10, 15m, check at close.
Filter: RSI > 65 in the same group - short after overbought with fading volume confirmation.
Fits short grids at local peaks when price rise is not volume-backed.
Strong volume impulse (gt filter)
Long: VOSC gt 0 on 1h, short 5 / long 10 - bot starts only with clear short-term volume above average.
Short: VOSC lt 0 on 1h.
Useful in trends where cross up 0 already happened but volume activity still favors you.
Pullback in trend
Group 1: VOSC on 4h greater than 0 (short 5 / long 20) AND VOSC cross up 0 on 15m (5/10).
Logic: higher TF shows sustained volume impulse; lower TF catches resumption after a low-volume correction.
Volume Oscillator + RSI
Long: RSI cross up 30 on 15m AND VOSC cross up 0 on 15m - price oscillator and volume activity aligned.
Short: RSI cross down 70 AND VOSC cross down 0.
RSI catches oversold/overbought; VOSC checks that volume actually strengthened in the right direction.
Multi-timeframe
Long: VOSC on 4h ≥ 0 (separate condition, gte, short 5 / long 20) AND VOSC cross up 0 on 15m (5/10).
Short: VOSC 4h ≤ 0 AND VOSC cross down 0 on 15m.
This avoids buying every local volume spike against global activity contraction on the higher interval.
DCA on pullback
Long: VOSC cross up 0 on 1h (short 5 / long 14) AND RSI < 45 on 1h - volume activity bounce from weakness without extreme oversold.
Short: VOSC cross down 0 AND RSI > 55.
For a DCA bot on trend pullbacks, cross up 0 is softer than strict RSI < 30.
Condition groups: practical example
Bot with two Long scenarios:
Group 1: VOSC cross up 0 on 15m AND price > EMA 50 - trend resumption with volume.
Group 2: VOSC gt 0 on 1h (5/20) AND RSI < 40 on 15m - bounce with confirmed higher-TF volume impulse.
Groups combined with OR: either scenario can start the bot. Configure Short symmetrically (cross down 0, VOSC lt 0).
Tip
On thin altcoins and during low-liquidity hours volume is unstable - VOSC may cross zero often without meaningful price moves. Increase long_period (20 instead of 10), add an EMA filter, or require VOSC ≥ 0 on a higher timeframe. VOSC does not replace price analysis - combine with Bollinger breakouts or trend context. Use check at bar close to ignore intrabar volume noise.