
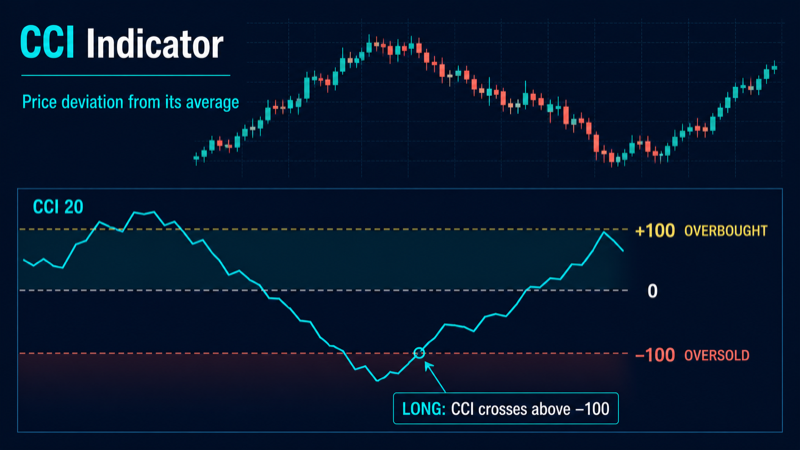
The Start Bots Signal category describes signals and indicators that can start a trading bot. One of the technical indicators is CCI (Commodity Channel Index).
When creating or editing any bot, there is a Start signal builder block at the bottom of settings. You can choose individual indicators, ready-made presets, and their combinations. Conditions are grouped: AND inside a group, OR between groups. The same indicator can be configured in different ways - for Long and Short, for breakouts and bounces, for level comparisons and for crosses.
What is CCI
CCI (Commodity Channel Index) is an oscillator developed by Donald Lambert in 1980. Unlike RSI, CCI is not bounded to 0–100: it shows how far the current typical price has deviated from its moving average, measured in units of mean deviation. The stronger the impulse, the farther CCI moves from zero - up or down.
In the ELIXOAI start signal builder, CCI is used as an automatic bot start condition: when the oscillator reaches a set level or crosses it, the bot can open a new grid or trade sequence. One preset is configured for the classic Long signal “leaving oversold” - a cross above −100 - but the indicator can be fully customized for any strategy.
How CCI works
CCI is built on each candle’s typical price and compares it with the average over the selected period:
- Typical price TP = (High + Low + Close) ÷ 3.
- SMA - simple moving average of typical price over N periods (default N = 20).
- Mean Deviation - average absolute distance of each TP from the SMA over the same period.
- CCI = (TP − SMA) ÷ (0.015 × Mean Deviation). The constant 0.015 is chosen so that roughly 70–80% of values fall within ±100.
When price stays above its average, CCI rises; when below, it falls. A strong trend can keep CCI far beyond ±100 - normal behavior, not an indicator “error”.
In the builder you do not configure the formula - you set a comparison condition: “CCI less than −100”, “CCI crosses above 0”, “CCI greater than +100”, and so on. The system fetches live CCI from the exchange via TAAPI and checks the condition on your timeframe - at candle close or every minute.
Typical CCI levels
Lambert proposed ±100 as the boundaries of “normal” deviation. In practice traders also use wider zones:
- +200 / −200: extreme overbought or oversold; rare but strong counter-trend or reversal confirmation signals.
- +100 / −100: classic overbought (+100) and oversold (−100) zones; the most common thresholds for cross signals.
- 0: rough “neutral” line - CCI above 0 means typical price is above its period average, below 0 the opposite.
In the builder the target value is a number: −200, −100, 0, +100, +200, or any other reasonable level. Thresholds are not fixed - choose them for your timeframe and trading style.
How CCI differs from RSI
RSI and CCI are often used for similar tasks - finding oversold and overbought conditions - but they are calculated differently:
- Scale: RSI is capped at 0–100; CCI has no hard limits and can reach −300, +400, or higher in strong trends.
- Calculation basis: RSI compares average gains and losses of the close; CCI measures deviation of typical price from its statistical mean.
- Trend sensitivity: RSI can “stick” in overbought/oversold zones; CCI in a trend often stays beyond ±100, reflecting persistent deviation from the mean.
- Levels: RSI uses classic 30/70 (or 20/80); CCI uses ±100 and ±200 relative to zero, plus the zero line as a momentum filter.
Combining CCI and RSI in one condition group gives a stronger signal: both oscillators must confirm oversold or overbought before the bot starts.
Period parameter
- Range: 2 to 300.
- Default: 20 - Lambert’s classic, suitable for most timeframes.
- Short period (10–14): faster CCI, more frequent ±100 readings, more signals and noise. Useful on 5m–15m for scalping.
- Long period (30–50): smoother CCI, fewer extremes. Better for 1h–4h swing trading.
Period is tied to the timeframe: CCI(20) on 5m and CCI(20) on 4h are different indicators. When you change the interval, revisit both thresholds and period.
Ready-made presets in the builder
The builder offers one ready-made CCI preset for Long. It can be fully changed: different operator, level, period, timeframe, or trade direction.
CCI crosses above −100 - Long (cci)
Default condition: CCI crosses level −100 from below to above (cross up) on the selected timeframe (15m interval, period 20, check at bar close).
The classic “leaving oversold” signal. CCI was below −100 - price deviated strongly below its mean - and moved back above that threshold. Softer than strict CCI < −200: the bot starts at early signs of recovery, not at the deepest pullback.
The preset is oriented toward Long. For Short, configure a symmetric condition manually - e.g. cross down +100 or CCI > +100.
Operators and Long/Short customization
Besides crosses, level comparison operators are available. All work with any target value:
- Greater than (gt): CCI strictly above the level. Long: gt 0 - bullish impulse; Short: gt +100 - overbought.
- Greater or equal (gte): CCI at or above the level. Useful when you do not want to miss a touch of the threshold.
- Less than (lt): CCI strictly below the level. Long: lt −100 - deep oversold; Short: lt 0 - bearish impulse.
- Less or equal (lte): CCI at or below the level. Long: lte −100 - entering the oversold zone.
- Crosses above (cross up): CCI was below the level and rose above. Long: cross up −100 (preset), cross up 0 (momentum shift).
- Crosses below (cross down): CCI was above the level and dropped below. Short: cross down +100 (leaving overbought), cross down 0.
Levels −200, −100, 0, +100, +200
Quick guide to typical operator and level combinations:
- Long: cross up −100 (preset), lt −100 or lt −200 (aggressive counter-trend), cross up 0 (upward impulse), gt 0 (bullish context filter on a higher TF).
- Short: cross down +100 (mirror of preset), gt +100 or gt +200 (overbought), cross down 0 (downward impulse), lt 0 (bearish context filter).
General builder settings
- Timeframe (interval): 1m, 5m, 15m, 30m, 1h, 4h, 1d. Shorter intervals give more signals but more noise. Swing bots often use 1h–4h; scalping uses 5m–15m.
- Check mode: At candle close checks after the candle closes - fewer false triggers. Every minute checks inside the current candle - faster reaction, higher false-start risk.
- Operator: greater than, less than, crosses above, crosses below, greater or equal, and others define how the indicator value is compared to the target.
- Target value: a number (e.g. 30 for RSI), an indicator line (e.g. %D for Stochastic), or price (for Bollinger Bands).
- Condition groups: up to 3 groups with up to 5 conditions each. Example: group 1 - RSI < 30 AND price < lower band; group 2 - Stochastic < 20. The bot starts if group 1 OR group 2 is satisfied.
Setup examples for different strategies
Scalping on 5m–15m
Goal: frequent starts on short bounces.
Long: CCI cross up −100, 5m timeframe, period 14, check at bar close.
Short: CCI cross down +100, same settings.
Filter: CCI on 1h > 0 for Long - avoid catching bounces in a global downtrend.
Swing on 1h–4h
Goal: fewer but more meaningful moves.
Long: CCI cross up −100, 4h interval, period 20, check at close.
Short: CCI cross down +100 on 4h.
On higher TFs cross signals are more reliable than strict lt −200 - fewer false starts during extended drops.
Deep oversold (lt −200)
Goal: counter-trend entry at an extreme.
Long: CCI < −200 on 15m, period 20, check at close AND RSI < 25 on the same 15m.
Short: CCI > +200 AND RSI > 75.
Rare but strong signals - fits a DCA grid on a pullback.
Short on overbought (+100)
Goal: short grid after overheated impulse.
Short: CCI cross down +100 on 15m, period 20.
Alternative: CCI > +100 (gt) - the bot starts while CCI stays overbought; more aggressive than cross.
In a strong bull trend CCI can stay above +100 for a long time - add a CCI 4h < +200 filter.
Zero cross (trend momentum)
Goal: start when buyers or sellers take control.
Long: CCI cross up 0 on 1h, period 20, check at close.
Short: CCI cross down 0 on 1h.
The zero line is the rough boundary between bullish and bearish impulse over the period. To filter chop, require CCI on 4h already above +50 for Long.
Trend filter
Goal: Long only in bullish context.
Long: group 1 - CCI cross up −100 on 15m AND CCI on 4h > 0 (separate CCI condition, gt operator, target 0, period 20).
Short: CCI cross down +100 on 15m AND CCI on 4h < 0.
This avoids buying every CCI bounce in a global downtrend.
CCI + RSI
Two oscillators confirming each other - stronger but rarer signals.
Long: CCI cross up −100 on 15m (period 20) AND RSI < 30 on the same 15m (period 14).
Short: CCI cross down +100 AND RSI > 70.
RSI captures relative strength, CCI statistical deviation; together they filter some false starts.
CCI + Bollinger Bands
Oscillator plus volatility - a classic mean-reversion combo.
Long: CCI < −100 on 15m AND close below the lower BBands band (20, 2).
Short: CCI > +100 AND price above the upper band.
On 1h you can relax to cross up −100 without BBands - bands on a higher TF less often align with CCI extremes.
±200 extreme with cross confirmation
Goal: two-step entry - extreme first, then confirmation.
Long: group 1 - CCI lt −200 on 15m (extreme) AND CCI cross up −100 on 5m (recovery starting).
Short: CCI gt +200 on 15m AND CCI cross down +100 on 5m.
Use OR between groups if you want separate scenarios.
Condition groups: practical example
A bot with two Long scenarios:
Group 1: CCI cross up −100 on 15m AND CCI 4h > 0 - trend pullback.
Group 2: CCI lt −200 on 15m AND Stochastic < 15 - aggressive counter-trend.
Groups are combined with OR: either scenario can start the bot. Configure Short symmetrically with +100 and +200.
Tip
In a strong trend CCI can remain above +100 or below −100 for a long time. Counter-trend signals like “CCI > +100 → Short” or “CCI < −100 → Long” often start the bot against the main move. Add a higher-timeframe filter, the zero line, or a second oscillator - and always respect grid risk management.