
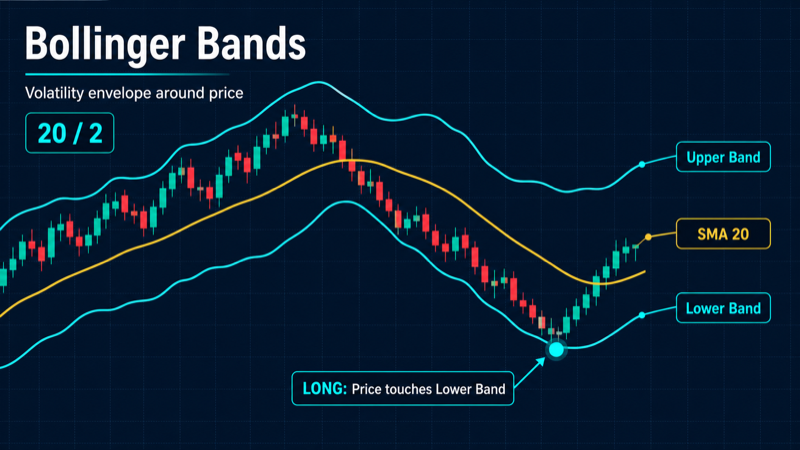
The Start Bots Signal category describes signals and indicators that can start a trading bot. One of the technical indicators is Bollinger Bands.
When creating or editing any bot, there is a Start signal builder block at the bottom of settings. You can choose individual indicators, ready-made presets, and their combinations. Conditions are grouped: AND inside a group, OR between groups. The same indicator can be configured in different ways - for Long and Short, for breakouts and bounces, for level comparisons and for crosses.
What are Bollinger Bands
Bollinger Bands are a volatility channel indicator built around a simple moving average (SMA). Three lines: upper, middle (SMA), and lower. Channel width depends on price standard deviation over the selected period - bands widen in strong moves and narrow in flat markets.
In the signal builder, conditions compare price to band lines or track crosses of price with channel boundaries. The same indicator works for bounces off bands, breakouts, and returns into the channel after an extreme move.
Ready-made presets in the builder
The builder offers four ready-made presets with different operators and trade direction. Each preset can be customized: another timeframe, period, stddev, or combination with other indicators.
bbands_value_down - price above upper band (Short)
Condition: price is greater than the upper band (valueUpperBand). An extreme upward break relative to current volatility - overbought. Starts a Short bot expecting a return to the middle line or a pullback. Default operator: greater than; output: upper band; target: price.
bbands_value_up - price below lower band (Long)
Condition: price is less than the lower band (valueLowerBand). Oversold relative to volatility - signal for a Long bot on a bounce toward the middle line. Default operator: less than; output: lower band; target: price.
bbands_cross_down - price crosses below upper band (Short)
Condition: price crosses down through the upper band - return into the channel after an upward break. Softer than entering at the breakout moment: confirms reversal or pullback start. Operator: crosses below; output: upper band; target: price.
bbands_cross_up - price crosses above lower band (Long)
Condition: price crosses up through the lower band - return into the channel from below after a drop. Classic mean-reversion signal: price exited the lower boundary and moved back inside. Operator: crosses above; output: lower band; target: price.
Bollinger Bands parameters
- Period (period, default 20): number of candles for the center SMA and standard deviation. A shorter period (e.g. 10) makes bands more sensitive; a longer one (50) smooths the channel and produces fewer signals.
- Deviation (stddev, default 2): standard-deviation multiplier for band width. Value 2 is the classic setting; 2.5–3 means fewer breaks but stronger extremes; 1.5 means more touches and more signals.
- Indicator outputs:
valueUpperBand(upper),valueMiddleBand(middle SMA),valueLowerBand(lower). You can compare price to any line or build crosses.
All four presets use period 20 and stddev 2 by default. In manual setup you can change any parameter and pick another output or operator.
General builder settings
- Timeframe (interval): 1m, 5m, 15m, 30m, 1h, 4h, 1d. Shorter intervals give more signals but more noise. Swing bots often use 1h–4h; scalping uses 5m–15m.
- Check mode: At candle close checks after the candle closes - fewer false triggers. Every minute checks inside the current candle - faster reaction, higher false-start risk.
- Operator: greater than, less than, crosses above, crosses below, greater or equal, and others define how the indicator value is compared to the target.
- Target value: a number (e.g. 30 for RSI), an indicator line (e.g. %D for Stochastic), or price (for Bollinger Bands).
- Condition groups: up to 3 groups with up to 5 conditions each. Example: group 1 - RSI < 30 AND price < lower band; group 2 - Stochastic < 20. The bot starts if group 1 OR group 2 is satisfied.
Setup examples for different strategies
One Bollinger Bands indicator covers many strategies - change the operator, comparison line, or add a filter in another condition group.
- Mean reversion: Long - price below lower band (
bbands_value_up) or cross above lower band (bbands_cross_up); Short - price above upper band (bbands_value_down) or cross below upper band (bbands_cross_down). Works well in sideways and range-bound markets. - Breakout: Long - price crosses above upper band (manual: output
valueUpperBand, operator crosses above, target price); Short - crosses below lower band. Used in trends to enter on momentum continuation after the channel expands. - Squeeze: When bands narrow (low volatility), the first break of upper or lower boundary often starts a strong move. Start the bot on cross above upper or cross below lower after a tight channel; add a second group filter - e.g. RSI > 50 for Long.
- Middle band cross: Price crosses above middle band (
valueMiddleBand) - trend Long; crosses below middle - Short. The middle line is the SMA with the same period, useful as dynamic support or resistance. - Combinations with RSI and Stochastic: Group 1: price < lower band AND RSI < 30 - Long on oversold; group 2: cross above lower band OR Stochastic cross above 20. This reduces false starts on weak band touches.
- stddev 1.5 vs 2.5: With stddev 1.5 bands are tighter -
bbands_value_upandbbands_value_downtrigger more often, useful on 5m–15m. With stddev 2.5 - fewer but stronger signals; cross presets pair well with at candle close check mode. - period 20 vs 50: period 20 is standard for intraday and 15m–1h. period 50 gives broader context on 4h–1d with less noise; cross above lower band on 4h often means a larger bounce than on 15m.
Tip
In a strong trend, price can “ride the band” - stay near the upper band in an uptrend or the lower band in a downtrend for a long time. Mean-reversion presets (bbands_value_downfor Short,bbands_value_upfor Long) then give early counter-trend entries. In trends, use breakouts and crosses in the direction of the move; in ranges, use returns into the channel and band touches.