
The Start Bots Signal category describes signals and indicators that can start a trading bot. One of the technical indicators is Parabolic SAR.
When creating or editing any bot, there is a Start signal builder block at the bottom of settings. You can choose individual indicators, ready-made presets, and their combinations. Conditions are grouped: AND inside a group, OR between groups. The same indicator can be configured in different ways - for Long and Short, for breakouts and bounces, for level comparisons and for crosses.
What is Parabolic SAR
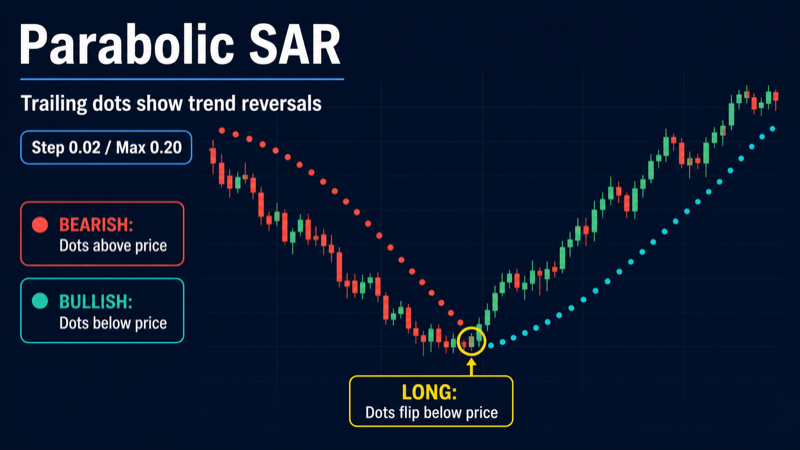
Parabolic SAR (PSAR, Stop And Reverse) is Welles Wilder's trend indicator that plots a series of dots or a line above or below price. When dots sit below candles, an uptrend dominates; when above, a downtrend dominates. The line "pulls" toward price along a parabolic curve and visually resembles a trailing stop.
PSAR is built to follow trends and mark reversals: when price crosses the SAR line, the indicator "flips" to the opposite side of the chart. In the ELIXOAI start signal builder, Parabolic SAR is used as an automatic bot start condition - on bullish or bearish price crosses of the value output (PSAR line).
PSAR's strength is simplicity and clarity in trending phases. Its weakness is frequent false flips in ranges and sideways markets where price chops around the line. Traders almost always combine PSAR with filters (EMA, higher timeframe, RSI) or use it on intervals where trend is stronger.
Parabolic SAR vs EMA and trailing stop
PSAR is often compared to other trend tools:
- EMA is a smoothed price average; a price cross shows momentum shift but the line does not flip automatically. PSAR explicitly switches sides (above/below price) and accelerates toward price as the trend develops via the Acceleration Factor (AF).
- Trailing stop is a fixed exit rule (percent or ATR from the extreme). PSAR is a formalized trailing algorithm: AF grows with each new extreme in the trend direction, so the line closes in on price faster in strong moves.
- Parabolic SAR is the only one of the three that delivers a ready "Stop And Reverse" signal: cross up price = bullish flip, cross down price = bearish flip. In the builder, output value (PSAR line) is compared to price.
How Parabolic SAR works
The PSAR algorithm tracks extremes and increases the Acceleration Factor (AF) with each new high (in uptrend) or low (in downtrend) until Maximum AF is reached:
- Price above the PSAR line - uptrend; dots/line below candles. Long context: trend in your favor.
- Price below the PSAR line - downtrend; dots above candles. Short context.
- A cross - price breaks through the PSAR line: the indicator flips to the other side. That is the trend-change signal for psar_bullish and psar_bearish presets.
In the builder you set a comparison condition for value vs price: "price crosses PSAR up," "price crosses PSAR down," "price above PSAR," and so on. The system fetches live Parabolic SAR from the exchange via TAAPI and checks the condition on your timeframe - at candle close or every minute.
Acceleration Factor parameters
- Start AF (start): initial acceleration factor, default 0.02 (range 0.001–1). Controls how quickly the PSAR line catches up to price at the start of a trend.
- Increment AF (increment): AF step increase on each new extreme, default 0.02. Higher increment - line closes in faster, more flips.
- Max AF (maximum): maximum AF, default 0.2 (range 0.01–2). Caps how fast the line approaches price in a long trend.
Wilder's classic 0.02 / 0.02 / 0.2 suits 15m–4h. For 5m scalping you can lower AF (0.01 / 0.01 / 0.1) - less lag, more noise. PSAR(0.02) on 5m and on 4h are different indicators; when changing timeframe, revisit both AF and signal type.
Ready-made presets in the builder
The builder offers two Parabolic SAR presets with default settings. Each can be fully customized: different operator, AF parameters, or timeframe.
Price crosses PSAR up - Long (psar_bullish)
Default condition: output value (Parabolic SAR line) - cross up price: price crosses the PSAR line from below to above on 15m, check at bar close. AF parameters: start 0.02, increment 0.02, maximum 0.2.
Long signal on a bullish flip: price was at or below the PSAR line and closed above - trend turned up, PSAR dots switched below candles. Unlike "price > PSAR," the cross captures the flip moment, not just holding above the line.
Price crosses PSAR down - Short (psar_bearish)
Default condition: value cross down price - price crosses the PSAR line from above to below on 15m, check at bar close. Same default AF parameters.
Short signal on a bearish flip: price was above PSAR and moved below - downtrend, dots above candles. Symmetric setup for short grids and bearish bots.
Available operators- Crosses above (cross up): Price was below PSAR and moved above. Classic Long setup - psar_bullish preset: bullish trend flip.
- Crosses below (cross down): Price was above PSAR and dropped below. Short signal - psar_bearish preset: bearish flip.
- Greater than (gt): Price is strictly above the PSAR line right now. Bullish context filter without requiring a fresh cross - bot starts already inside an uptrend.
- Less than (lt): Price is strictly below PSAR. Bearish context - useful for Short filters on a higher timeframe.
- Greater or equal (gte): Price is at or above PSAR. Handy for "price ≥ PSAR" filter on 4h when entering on 15m.
- Less or equal (lte): Price is at or below PSAR. Bearish context filter on a higher interval.
Price above the PSAR line means uptrend; below means downtrend. Cross up price marks a shift from bearish to bullish phase; cross down the reverse. In a strong trend price can stay on one side for a long time - then gt/lt gives earlier continuation entry while cross gives a precise flip moment.
General builder settings
- Timeframe (interval): 1m, 5m, 15m, 30m, 1h, 4h, 1d. Shorter intervals give more signals but more noise. Swing bots often use 1h–4h; scalping uses 5m–15m.
- Check mode: At candle close checks after the candle closes - fewer false triggers. Every minute checks inside the current candle - faster reaction, higher false-start risk.
- Operator: greater than, less than, crosses above, crosses below, greater or equal, and others define how the indicator value is compared to the target.
- Target value: a number (e.g. 30 for RSI), an indicator line (e.g. %D for Stochastic), or price (for Bollinger Bands).
- Condition groups: up to 3 groups with up to 5 conditions each. Example: group 1 - RSI < 30 AND price < lower band; group 2 - Stochastic < 20. The bot starts if group 1 OR group 2 is satisfied.
Setup examples for different strategies
Scalping: PSAR on 5m–15m
Goal: frequent starts on short trend flips.
Long: psar_bullish preset, cross up price, 5m timeframe, AF 0.02/0.02/0.2, check at bar close.
Short: psar_bearish, cross down price, same settings.
Filter: price above EMA 20 on the same 5m - fewer false flips in a range.
Swing: PSAR on 1h–4h
Goal: fewer but more meaningful trend changes.
Long: psar_bullish on 4h, check at close - bot starts on a sustained bullish flip.
Short: psar_bearish on 4h.
On a higher TF PSAR filters noise and signals closer to a "real" reversal.
Trend confirmation
Goal: Long only when PSAR and EMA align.
Group 1: psar_bullish (cross up price) on 15m AND close price above EMA 50 on the same 15m.
Short: psar_bearish AND price below EMA 50.
EMA shows direction; PSAR confirms the flip moment.
Breakout
Goal: start the bot on impulse after consolidation.
Long: price gt PSAR on 15m AND price cross up upper Bollinger Band (20, 2) on the same interval.
Short: price lt PSAR AND price below lower BBands.
PSAR gt confirms the breakout is trend-backed, not a random spike.
PSAR + EMA
Long: psar_bullish on 15m AND price cross up EMA 20 on the same 15m - double confirmation: PSAR flip and average cross.
Short: psar_bearish AND price cross down EMA 20.
Alternative: price gt PSAR on 1h AND price > EMA 50 on 1h - trend Long without waiting for a fresh cross.
Short on bearish flip
Condition: psar_bearish (cross down price) or price < PSAR, 15m, check at close.
Filter: RSI > 65 in the same group - short after overbought with PSAR reversal confirmation.
Fits short grids at local peaks.
Trend continuation (gt filter)
Long: price gt PSAR (value) on 1h - bot starts only in clear uptrend, without waiting for a cross.
Short: price lt PSAR on 1h.
Useful when psar_bullish already fired but trend still favors you. Downside - later entry vs cross.
Pullback in trend
Group 1: price on 4h gt PSAR AND psar_bullish (cross up price) on 15m.
Logic: higher TF shows sustained uptrend; lower TF catches resumption after a short correction toward the PSAR line. Fewer false starts against the global trend.
PSAR + RSI
Long: RSI cross up 30 on 15m AND psar_bullish on 15m - oscillator and trend flip aligned.
Short: RSI cross down 70 AND psar_bearish on 15m.
RSI catches oversold/overbought; PSAR checks for a real trend reversal.
Multi-timeframe
Long: price on 4h ≥ PSAR (separate condition, gte) AND psar_bullish on 15m.
Short: price 4h ≤ PSAR AND psar_bearish on 15m.
This avoids buying every local PSAR flip against global downtrend on the higher interval.
DCA on pullback
Long: psar_bullish on 1h AND RSI < 45 on 1h - trend bounce from weakness without extreme oversold.
Short: psar_bearish AND RSI > 55.
For a DCA bot on trend pullbacks, cross up price is softer than strict RSI < 30 - fewer false entries during ongoing drops.
Condition groups: practical example
Bot with two Long scenarios:
Group 1: psar_bullish on 15m AND price > EMA 50 - trend flip with average confirmation.
Group 2: price gt PSAR on 1h AND RSI < 40 on 15m - bounce with confirmed higher-TF uptrend.
Groups combined with OR: either scenario can start the bot. Configure Short symmetrically (psar_bearish, price lt PSAR).
Tip
In a ranging market PSAR flips constantly: psar_bullish and psar_bearish trigger often and produce false bot starts (whipsaw). Lower AF or add an EMA filter and require price gt PSAR on a higher timeframe. In pure chop PSAR is a weak standalone signal - combine with Bollinger breakouts or MACD. Use check at bar close to ignore intrabar noise.