
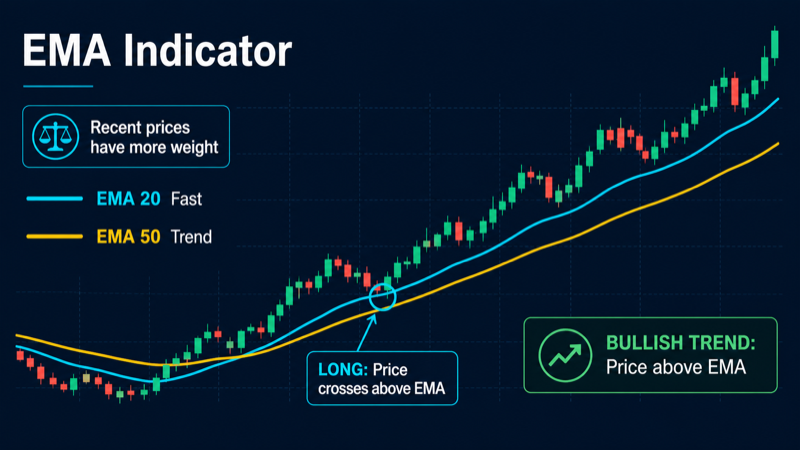
The Start Bots Signal category describes signals and indicators that can start a trading bot. One of the technical indicators is EMA (Exponential Moving Average).
When creating or editing any bot, there is a Start signal builder block at the bottom of settings. You can choose individual indicators, ready-made presets, and their combinations. Conditions are grouped: AND inside a group, OR between groups. The same indicator can be configured in different ways - for Long and Short, for breakouts and bounces, for level comparisons and for crosses.
What is EMA
EMA (Exponential Moving Average) is a trend indicator that averages closing prices with exponential weighting: recent candles influence the line more than older ones. Unlike SMA, EMA turns with price faster and signals momentum shifts earlier.
EMA vs SMA: SMA (Simple Moving Average) is the arithmetic mean over N periods - every candle counts equally. EMA gives more weight to recent data, so the line lags less and suits scalping and short timeframes better. SMA is smoother and is often used as a long-term filter (e.g. SMA 200 on the daily chart).
Price above EMA is usually read as bullish context: buyers hold the asset above the average. Price below EMA is bearish. A price cross above or below EMA is a classic local momentum shift signal. In the ELIXOAI start signal builder, EMA is used as an automatic bot start condition: when price crosses the line or two EMAs cross each other, the bot can open a new grid.
Golden cross - when the fast EMA crosses the slow EMA from below to above (classic pairs: 50/200 or 50/100). Often interpreted as the start or strengthening of an uptrend. Death cross - the opposite: fast EMA crosses slow EMA from above to below, often seen as trend weakness or a shift into a downtrend.
How EMA works
EMA is calculated iteratively: each new value uses the current price and the previous EMA with smoothing factor k = 2 ÷ (period + 1). The smaller the period, the higher k and the faster the line reacts.
- On the first bar, EMA is often initialized as SMA for the same period.
- On each next candle: EMA = (Close × k) + (EMAprev × (1 − k)).
- The line “pulls” toward price more strongly than SMA with the same period.
In the ELIXOAI builder you set a comparison condition, not the formula: “price crosses EMA 20 up,” “EMA 50 crosses EMA 100 up,” “price greater than EMA 200,” and so on. The system fetches live EMA values via TAAPI and checks the condition on your timeframe - at candle close or every minute.
Period parameter
EMA presets in the builder have a Period parameter (and slow_period for the cross preset):
- Range: 2 to 350.
- Default for ema preset: 20 - a versatile “working” average for 15m–1h.
- For ema_50_100_cross: fast EMA 50, slow EMA 100.
- Short periods (9–21): fast reaction, more signals and noise - scalping on 5m–15m.
- Long periods (50–200): strong trend filter, rare but meaningful crosses - swing and position trading.
Period is always tied to the timeframe: EMA(20) on 5m and EMA(20) on 4h are different lines with different roles. When you change the interval, revisit both period and filter logic.
Ready-made presets in the builder
The builder offers two ready-made EMA presets. Each can be customized: different operator, period, slow_period, or timeframe.
Price crosses EMA 20 up - Long (ema)
Default condition: price crosses EMA(20) from below to above (cross up) on the selected timeframe (15m interval, check at bar close).
A classic “bullish impulse return” signal: price was below EMA and closed above. Fits starting a Long bot on trend continuation after a pullback or on a local breakout. Operators: greater than, less than, crosses above, crosses below - you can set Short on cross down or a “price above EMA” filter without a cross.
For Short symmetry, use the same preset with crosses below or “price less than EMA.”
EMA 50 crosses EMA 100 up - Long (ema_50_100_cross)
Default condition: fast EMA(50) crosses slow EMA(100) from below to above (cross up).
A simplified golden cross: the fast average overtakes the slow one - a sign of strengthening uptrend. Rarer than price crossing EMA 20, but usually more reliable on medium timeframes (1h–4h). For Short and death cross, switch the operator to crosses below or add a separate cross down condition.
Parameters: period (fast, default 50) and slow_period (slow, default 100). You can try 9/21 for scalping or 50/200 for the classic golden cross.
General builder settings
- Timeframe (interval): 1m, 5m, 15m, 30m, 1h, 4h, 1d. Shorter intervals give more signals but more noise. Swing bots often use 1h–4h; scalping uses 5m–15m.
- Check mode: At candle close checks after the candle closes - fewer false triggers. Every minute checks inside the current candle - faster reaction, higher false-start risk.
- Operator: greater than, less than, crosses above, crosses below, greater or equal, and others define how the indicator value is compared to the target.
- Target value: a number (e.g. 30 for RSI), an indicator line (e.g. %D for Stochastic), or price (for Bollinger Bands).
- Condition groups: up to 3 groups with up to 5 conditions each. Example: group 1 - RSI < 30 AND price < lower band; group 2 - Stochastic < 20. The bot starts if group 1 OR group 2 is satisfied.
Setup examples for different strategies
Trend filter
Goal: Long only when the higher trend is bullish, Short when bearish.
- Long: group 1 - price crosses EMA 20 up on 15m AND price on 4h greater than EMA 200 (separate ema condition, period 200, operator “greater than”).
- Short: price crosses EMA 20 down on 15m AND price on 4h less than EMA 200.
- This avoids buying every local bounce in a global downtrend.
Pullback entry
Goal: buy trend continuation after a correction to the average.
- Long: on 1h price greater than EMA 50 (uptrend) AND on 15m price crosses EMA 20 up after touching the EMA 50 zone.
- Short: price below EMA 50 on 1h AND EMA 20 cross down on 15m.
- Check at bar close to reduce false triggers from intrabar noise.
9/21 scalping on 5m–15m
Goal: frequent starts on short impulses.
- Long: ema_50_100_cross preset with period 9 and slow_period 21, cross up operator, 5m or 15m timeframe.
- Short: same preset with cross down.
- The fast EMA pair reacts quicker than classic 50/100 - more signals, more noise; suited for active grids with strict risk management.
Golden cross 50/200
Goal: rare but strong long-term trend shift signal.
- Long: ema_50_100_cross with period 50 and slow_period 200 on 4h or 1d, cross up, check at close.
- Short (death cross): cross down on the same parameters.
- Classic reading: golden cross confirms a bull cycle, death cross a bear cycle. On crypto the signal can lag - combine with volume or RSI.
Multi-timeframe
Goal: align a lower-TF signal with higher-TF context.
- Long: EMA 50 cross up EMA 100 on 1h AND price crosses EMA 20 up on 15m.
- Short: death cross on 1h AND price crosses EMA 20 down on 15m.
- Lower TF gives entry timing, higher TF gives direction. Use AND between groups.
EMA + RSI
Trend plus oscillator - filter overheated entries and catch pullbacks.
- Long: price above EMA 50 on 1h AND RSI crosses 30 up on 15m (RSI period 14).
- Short: price below EMA 50 on 1h AND RSI crosses 70 down on 15m.
- EMA sets direction, RSI sets entry timing after a correction.
EMA + MACD
Two trend tools with different logic confirm momentum.
- Long: price crosses EMA 20 up on 15m AND MACD histogram crosses 0 up on the same 15m.
- Short: EMA 20 cross down AND MACD hist cross down through 0.
- MACD already uses EMA in its calculation - the combo tightens the filter and produces fewer signals.
Swing on 4h with EMA 50
Goal: fewer but more meaningful moves.
- Long: price crosses EMA 50 up on 4h, period 50, check at close.
- Short: EMA 50 cross down on 4h.
- For a DCA bot on trend pullbacks, add a filter: price on 1d above EMA 200 for Long.
Hold above EMA without a cross
Goal: start only in a sustained trend, without waiting for a cross.
- Long: price greater than EMA 20 on 15m (operator “greater than,” not cross) AND EMA 9 greater than EMA 21 on the same TF (second condition via ema_50_100_cross with period 9 / slow_period 21, operator “greater than”).
- Short: price less than EMA 20 AND EMA 9 less than EMA 21.
- Suits “trend” grids that should start already inside the move.
Death cross for Short
Goal: short grid on trend weakness.
- Short: ema_50_100_cross, period 50, slow_period 100, operator cross down on 1h.
- Optional: RSI on 4h less than 50 to confirm bearish impulse.
- In a range, death cross produces many false signals - add a higher EMA or volatility filter.
Condition groups: practical example
A bot with two Long scenarios:
- Group 1: price cross up EMA 20 on 15m AND price above EMA 200 on 4h - trend pullback.
- Group 2: EMA 50 cross up EMA 100 on 1h AND RSI < 40 on 15m - early entry into a new impulse.
Groups are combined with OR: either scenario can start the bot. Configure Short symmetrically.
Tip
EMA is a lagging indicator: a cross confirms a move that has already started, it does not predict reversals in advance. In a range, price often chops around EMA 20 - cross up and cross down fire in alternation. Add a higher-timeframe filter (price above/below EMA 50 or 200), combine with RSI or MACD, and always respect grid risk management. Golden cross on 50/200 is rare; for active trading use shorter pairs (9/21, 20/50).