
In der Kategorie Start Bots Signal finden Sie Beschreibungen von Signalen und Indikatoren, die einen Trading-Bot starten können. Einer der technischen Indikatoren ist DMI (Directional Movement Index).
Beim Erstellen und Bearbeiten jedes Bots gibt es unten in den Einstellungen den Block Startsignal-Editor. Dort können Sie einzelne Indikatoren, fertige Voreinstellungen und deren Kombinationen wählen. Bedingungen werden in Gruppen zusammengefasst: innerhalb einer Gruppe gilt UND, zwischen Gruppen ODER. Derselbe Indikator lässt sich unterschiedlich konfigurieren - für Long und Short, für Ausbrüche und Absprünge, für Levelvergleiche und Kreuzungen.
Was ist DMI (Directional Movement Index)
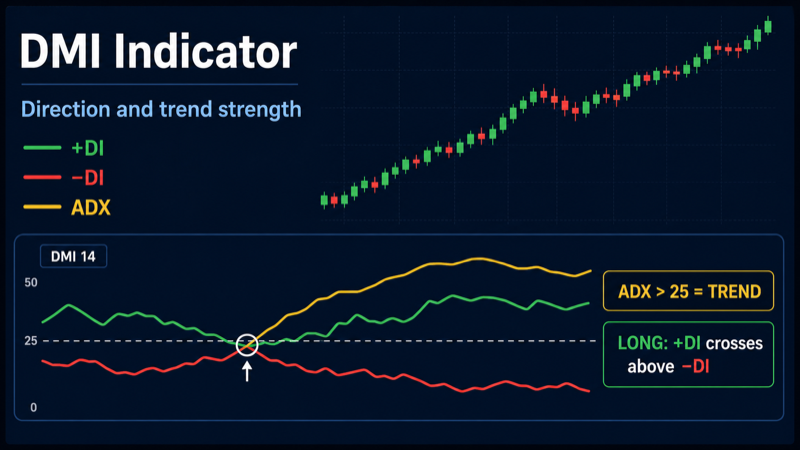
DMI (Directional Movement Index) ist ein Trendindikator von Welles Wilder. Er besteht aus drei Linien: +DI (Positive Directional Indicator, bullische Richtung), −DI (Negative Directional Indicator, bärische Richtung) und ADX (Average Directional Index). DMI beantwortet zwei Fragen: in welche Richtung sich der Markt bewegt und wie stark der Trend ausgeprägt ist.
Die +DI/−DI-Kreuzung ist das klassische Dominanzwechsel-Signal: wenn +DI über −DI kreuzt, übernehmen die Bullen; wenn −DI über +DI kreuzt, die Bären. Die Kreuzung allein misst aber nicht die Trendstärke - in Ranges peitschen die Linien hin und her. Dafür gibt es ADX: er misst die Trendintensität unabhängig von der Richtung.
Im ELIXOAI Startsignal-Editor dient DMI als Bedingung für den automatischen Bot-Start: das Preset dmi_cross erfasst +DI über −DI, das Preset dmi_adx_strength löst aus, wenn ADX 25 überschreitet.
DMI vs MACD und EMA
Alle drei Werkzeuge betreffen den Trend, lösen aber unterschiedliche Aufgaben:
- MACD is built on the difference between two EMAs and shows momentum through line or zero crosses. MACD has no separate “trend strength” metric - only direction and acceleration. DMI explicitly separates direction (+DI vs −DI) and strength (ADX).
- EMA is a price moving average; price position vs EMA shows trend but not strength. DMI +DI/−DI crosses give earlier momentum shift signals; ADX filters weak moves in chop.
- DMI is the only one of the three that gives a numeric trend strength reading via ADX. Classic thresholds: ADX < 20 - weak trend or range; 20–25 - trend forming; > 25 - trend strong enough to trade; > 40–50 - very strong trend (watch for reversals).
Wie DMI funktioniert
DMI is calculated from True Range and directional movement over a period (default 14 candles):
- +DI (pdi) - upward movement strength. The higher +DI vs −DI, the more buyers dominate.
- −DI (mdi) - downward movement strength. When −DI is above +DI, bears control the market.
- ADX (adx) - smoothed measure of divergence between +DI and −DI. ADX does not show direction - it can rise in both rallies and selloffs. High ADX means the trend is strong, Long or Short.
In the builder you set a comparison condition on one output: “+DI crosses above −DI,” “ADX greater than 25,” “+DI greater than −DI,” and so on. The system fetches live DMI values from the exchange via TAAPI and checks the condition on your timeframe - at candle close or every minute.
Drei DMI-Ausgänge
The builder exposes three numeric outputs for the dmi indicator:
- pdi (+DI): positive directional indicator. Used as the main line in dmi_cross - pdi crossing mdi.
- mdi (−DI): negative directional indicator. In dmi_cross it is the cross target: pdi cross up mdi.
- adx (ADX): trend strength index. Used in dmi_adx_strength - ADX > 25 as a “trend strong enough” filter. Any threshold works: gt 20, gt 30, gte 25.
Parameter Periode
- Bereich: 1 to 300.
- Standard: 14 - Wilder’s classic setting; balanced for 15m–4h.
- Short period (7–10): DMI reacts faster, more +DI/−DI crosses, more false signals in ranges. Useful on 5m–15m for scalping with a mandatory ADX filter.
- Long period (20–28): smoother DMI, less frequent dominance changes. Better for 1h–4h swing - fewer but more sustained trend signals.
DMI(14) on 15m and DMI(14) on 4h are different indicators. When changing timeframe, revisit period and preset mix (cross vs adx_strength).
Fertige Voreinstellungen im Editor
Im Editor stehen zwei DMI-Presets bereit with default settings. Each can be fully customized: different operator, output, threshold, or timeframe.
dmi_cross - +DI crosses above −DI (Long)
Standardbedingung: pdi (+DI) crosses mdi (−DI) from below to above (cross up) on the selected timeframe (15m interval, period 14, Prüfung beim Kerzenschluss).
Classic DMI Long signal: bullish direction begins to dominate bearish. Unlike “pdi > mdi,” the cross captures the transition moment, not just current position. For Short, set operator “crosses below” - pdi cross down mdi.
dmi_adx_strength - ADX > 25 (strong trend)
Standardbedingung: ADX greater than 25 (gt) on the selected timeframe (15m interval, period 14, Prüfung beim Kerzenschluss).
Trend strength filter: the bot starts when the market leaves chop and the trend becomes strong enough. ADX > 25 alone gives no direction - combine with dmi_cross, EMA, or price above/below a key average. For Short context, add mdi > pdi in the same group.
Verfügbare Operatoren- Kreuzt nach oben (cross up): Output was below the target and moved above. For dmi_cross: pdi cross up mdi - Long. Custom: adx cross up 25 - ADX just exceeded the strength threshold.
- Kreuzt nach unten (cross down): Output was above the target and dropped below. pdi cross down mdi - Short. adx cross down 25 - trend weakening, exit from strong move.
- Größer (gt): Value strictly above threshold. ADX gt 25 - strong trend right now. pdi gt mdi - bulls dominate without requiring a fresh cross.
- Kleiner (lt): Value strictly below threshold. ADX lt 20 - weak trend, range. mdi gt pdi (or pdi lt mdi) - bears dominate.
- Größer oder gleich (gte): Value at or above threshold. ADX gte 25 on 4h - sustained higher-TF trend as a filter.
- Kleiner oder gleich (lte): Value at or below threshold. ADX lte 20 - market in range, DMI crosses unreliable.
ADX is the key to filtering DMI noise. ADX < 20 - weak or no trend; +DI/−DI crosses are often false. ADX 20–25 - trend forming. ADX > 25 - trend strong enough to trade (dmi_adx_strength preset threshold). ADX > 40–50 - extremely strong trend; sharp corrections possible. ADX shows strength, not direction - for Long check pdi > mdi, for Short mdi > pdi.
Allgemeine Editor-Einstellungen
- Zeitrahmen (Intervall): 1m, 5m, 15m, 30m, 1h, 4h, 1d. Kürzere Intervalle liefern mehr Signale, aber mehr Rauschen. Swing-Bots nutzen oft 1h–4h, Scalping 5m–15m.
- Prüfmodus: Bei Kerzenschluss - Prüfung nach Kerzenschluss, weniger Fehlauslösungen. Jede Minute - Prüfung innerhalb der laufenden Kerze, schnellere Reaktion, höheres Fehlstart-Risiko.
- Operator: größer, kleiner, kreuzt nach oben/unten, größer oder gleich usw. legen fest, wie der Indikatorwert mit dem Ziel verglichen wird.
- Zielwert: Zahl (z. B. 30 beim RSI), Indikatorlinie (z. B. %D beim Stochastic) oder Preis (bei Bollinger Bands).
- Bedingungsgruppen: bis zu 3 Gruppen mit je bis zu 5 Bedingungen. Beispiel: Gruppe 1 - RSI < 30 UND Preis < unteres Band; Gruppe 2 - Stochastic < 20. Der Bot startet, wenn Gruppe 1 ODER Gruppe 2 erfüllt ist.
Einrichtungsbeispiele für verschiedene Strategien
Klassisches Long: dmi_cross
Ziel: bot start on dominance shifting to bulls.
Long: dmi_cross preset, pdi cross up mdi, 15m timeframe, period 14, check beim Kerzenschluss.
Short: pdi cross down mdi, same settings.
Basic DMI strategy without extra filters - more signals, higher false-cross risk in ranges.
Short bei −DI-Kreuzung
Bedingung: mdi cross up pdi (equivalent to pdi cross down mdi), period 14, 15m, check at close.
Filter: ADX gt 20 in the same group - short only when trend is forming, not in dead chop.
Fits short grids on local uptrend reversals.
DI-Kreuzung + ADX-Stärke
Gruppe 1: dmi_cross (pdi cross up mdi) on 15m UND dmi_adx_strength (ADX gt 25) on the same 15m.
Logik: Long only when both direction (+DI above −DI) and strength (ADX > 25) confirm. Fewer false starts than pure dmi_cross.
Short: pdi cross down mdi UND ADX gt 25 UND mdi > pdi.
Trendbestätigung via EMA
Long: dmi_cross on 15m UND close price above EMA 50 on 1h.
Short: pdi cross down mdi on 15m UND price below EMA 50 on 1h.
EMA shows global direction; DMI catches local momentum shift with the trend.
Scalping: Periode 10 auf 5m–15m
Long: dmi_cross, period 10, 5m timeframe, check at close UND ADX gt 20.
Short: pdi cross down mdi, same settings.
Period 10 speeds up DMI; ADX filter is mandatory - without it 5m whipsaws heavily.
Swing: Periode 14 auf 1h–4h
Long: dmi_cross on 4h, period 14, check at close UND ADX gt 25.
Short: pdi cross down mdi on 4h, ADX gt 25.
Rare but meaningful signals - closer to a “real” trend shift on a higher interval.
Multi-Timeframe
Long: ADX gt 25 on 4h (separate condition, dmi_adx_strength) UND dmi_cross on 15m.
Short: ADX gt 25 on 4h UND pdi cross down mdi on 15m.
Higher TF confirms trend strength; lower TF gives entry - avoids buying every local cross against weak global ADX.
DMI + RSI
Long: dmi_cross on 15m UND RSI cross up 30 (or RSI < 40) on the same 15m - DMI direction and RSI bounce aligned.
Short: pdi cross down mdi UND RSI cross down 70.
RSI catches oversold/overbought; DMI confirms directional dominance shift.
Pullback im Trend
Gruppe 1: pdi gt mdi on 4h (period 14) UND dmi_cross on 15m.
Logik: higher TF shows sustained bullish dominance (+DI above −DI); lower TF catches resumption after a short correction. Fewer false starts against the global trend.
Starker Trend: ADX gt 30
Long: ADX gt 30 on 1h UND pdi gt mdi on 1h - bot starts only in clearly strong trends.
Short: ADX gt 30 UND mdi gt pdi on 1h.
Stricter than 25 - fewer trades, higher quality in trending phases. Downside - later entry vs move start.
DCA bei Trend-Fortsetzung
Long: dmi_cross on 1h (period 14) UND ADX gte 20 on 1h UND price > EMA 200 on 4h.
Short: pdi cross down mdi UND ADX gte 20 UND price < EMA 200 on 4h.
For DCA bots on pullbacks: +DI/−DI cross is softer than a hard breakout; EMA 200 sets global context.
Bedingungsgruppen: Praxisbeispiel
Bot with two Long scenarios:
Gruppe 1: dmi_cross on 15m UND ADX gt 25 on 15m - impulse entry with confirmed strength.
Group 2: ADX gt 25 on 4h UND pdi gt mdi on 15m - higher-TF trend, bullish dominance on lower TF.
Groups combined with ODER: either scenario can start the bot. Configure Short symmetrically (pdi cross down mdi, mdi gt pdi).
Tipp
DMI-Kreuzung ohne ADX-Filter in Ranges erzeugt viele Fehlstarts bei ADX < 20. Kombinieren Sie dmi_cross mit dmi_adx_strength (ADX gt 25) oder höherem EMA-Filter. ADX zeigt Stärke, nicht Richtung - für Long pdi > mdi, für Short mdi > pdi.