
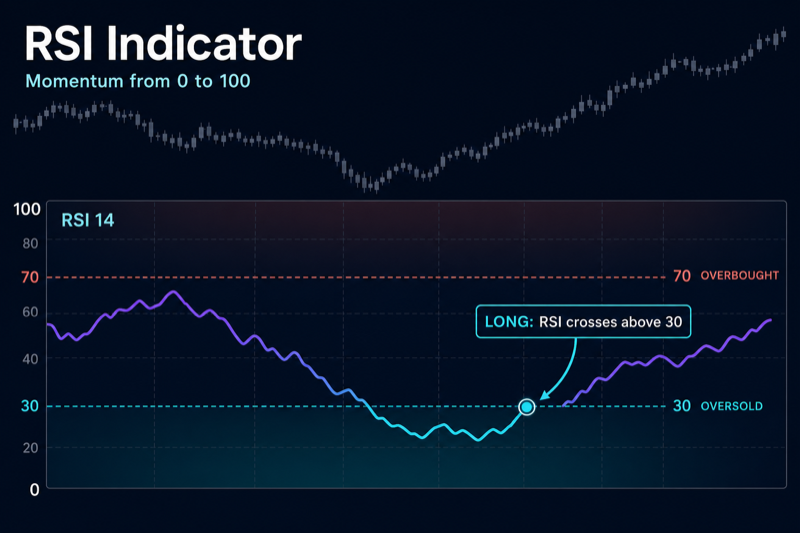
The Start Bots Signal category describes signals and indicators that can start a trading bot. One of the technical indicators is RSI (Relative Strength Index).
When creating or editing any bot, there is a Start signal builder block at the bottom of settings. You can choose individual indicators, ready-made presets, and their combinations. Conditions are grouped: AND inside a group, OR between groups. The same indicator can be configured in different ways - for Long and Short, for breakouts and bounces, for level comparisons and for crosses.
What is RSI
RSI (Relative Strength Index) is one of the most widely used oscillators in technical analysis. It was developed by J. Welles Wilder in 1978. The indicator measures the speed and magnitude of recent price changes and plots the result on a scale from 0 to 100.
RSI does not show trend direction by itself, but it helps you see how strong the latest move was and whether price has become “overheated.” Values below 30 are traditionally treated as oversold; above 70 as overbought. In the ELIXOAI start signal builder, RSI is used as an automatic bot start condition: when the oscillator reaches a set level or crosses it, the bot can open a new grid or trade sequence.
Unlike moving averages, RSI reacts to momentum - the acceleration of up or down moves. Traders often combine it with trend filters (EMA, price vs. average) or volatility tools (Bollinger Bands) to reduce false signals in ranges and extended trends.
How RSI works
RSI compares average gains over the chosen period with average losses over the same period. If gains dominated the last N candles, the indicator rises; if losses dominated, it falls.
Simplified logic for classic RSI(14):
- For each candle, the change in close vs. the previous close is calculated.
- Gains and losses are averaged over 14 periods (by default using Wilder’s smoothing).
- Relative strength RS = average gain ÷ average loss.
- RSI = 100 − (100 ÷ (1 + RS)).
When average gain is much larger than average loss, RSI moves toward 100. When losses dominate, it moves toward 0. A reading of 50 reflects rough balance between buyers and sellers over the selected period.
In the ELIXOAI builder you do not configure the formula - you set a comparison condition: “RSI less than 25,” “RSI greater than 70,” “RSI crosses above 30,” and so on. The system fetches live RSI from the exchange via TAAPI and checks the condition on your timeframe - at candle close or every minute.
Period parameter
All RSI presets in the builder share a Period parameter:
- Range: 2 to 300.
- Default: 14 - Wilder’s classic, suitable for most timeframes.
- Short period (5–9): faster RSI, more signals, more noise. Useful on 5m–15m for scalping if you accept more false starts.
- Long period (21–50): smoother RSI, fewer extremes. Better for 1h–4h swing trading - fewer but often stronger signals.
Period is always tied to the selected timeframe: RSI(14) on 5m and RSI(14) on 4h are different indicators with different sensitivity. When you change the interval, revisit both thresholds (25/30/70) and period.
Ready-made presets in the builder
The builder offers four ready-made RSI presets. Each can be customized: different operator, level, period, or timeframe.
RSI < 25 - Long (rsi_value)
Default condition: RSI value less than 25 on the selected timeframe (15m interval, check at bar close).
An aggressive Long signal on strong oversold readings. Threshold 25 is stricter than the classic 30 - the bot starts less often but closer to a local impulse low. Fits counter-trend setups: bounce after a sharp drop, DCA grid entry on a pullback.
Available operators: greater than, less than, greater or equal, less or equal, crosses above, crosses below. You can soften to RSI < 30 or tighten to RSI < 20.
RSI > 70 - Short (rsi_value_down)
Default condition: RSI value greater than 70.
A Short signal on overbought conditions - the mirror of the Long preset above. The bot starts when upward momentum is “overheated.” Often used for short grids at local peaks or overbought fades in a range.
In a strong bull trend RSI can stay above 70 for a long time - keep that in mind (see the tip at the end).
Cross above 30 - Long (rsi_cross_up)
Default condition: RSI crosses level 30 from below to above (cross up).
The classic “leaving oversold” signal. Unlike rsi_value, RSI does not need to be below 25 right now - what matters is the cross: the oscillator was below 30 and moved above. This is softer and produces more signals than strict RSI < 25.
Works well for trend pullbacks: price in an uptrend corrects, RSI dips toward 30 and recovers - the bot catches continuation.
Cross below 70 - Short (rsi_cross_down)
Default condition: RSI crosses level 70 from above to below (cross down).
A “leaving overbought” signal - RSI was above 70 and dropped below. Useful for shorts after a local peak or starting a short grid as momentum turns down.
In a falling market the cross below 70 can lag; for earlier entries some traders lower the level to 65 or add extra conditions.
General builder settings
- Timeframe (interval): 1m, 5m, 15m, 30m, 1h, 4h, 1d. Shorter intervals give more signals but more noise. Swing bots often use 1h–4h; scalping uses 5m–15m.
- Check mode: At candle close checks after the candle closes - fewer false triggers. Every minute checks inside the current candle - faster reaction, higher false-start risk.
- Operator: greater than, less than, crosses above, crosses below, greater or equal, and others define how the indicator value is compared to the target.
- Target value: a number (e.g. 30 for RSI), an indicator line (e.g. %D for Stochastic), or price (for Bollinger Bands).
- Condition groups: up to 3 groups with up to 5 conditions each. Example: group 1 - RSI < 30 AND price < lower band; group 2 - Stochastic < 20. The bot starts if group 1 OR group 2 is satisfied.
Setup examples for different strategies
Scalping on 5m–15m
Goal: frequent starts on short impulses.
- Long: rsi_cross_up preset, 5m or 15m timeframe, period 9, level 30, check at candle close.
- Short: rsi_cross_down, same settings, level 70.
- Optionally add volume or a higher timeframe filter (e.g. RSI on 1h not below 40 for Long) to avoid catching falling knives against the bigger trend.
Swing on 1h–4h
Goal: fewer but more meaningful moves.
- Long: rsi_value, 4h interval, period 14, RSI < 30 (or keep 25), check at close.
- Short: rsi_value_down, RSI > 70 on 4h.
- For a DCA bot on trend pullbacks, rsi_cross_up on 1h with period 14 often works better - fewer false entries during ongoing drops.
Counter-trend from extremes
Goal: enter on “overheated” or “oversold” price expecting a revert.
- Long: group 1 - RSI < 20 (period 14, 15m) AND price below the lower Bollinger Band on the same interval.
- Short: RSI > 80 AND price above the upper BBands line.
- Use check at bar close to ignore intrabar noise.
Trend filter
Goal: Long only in bullish context, Short in bearish.
- Long: group 1 - rsi_cross_up on 15m (cross above 30) AND RSI on 4h greater than 50 (separate RSI condition, operator “greater than,” target 50, period 14).
- Short: rsi_cross_down on 15m AND RSI on 4h less than 50.
- This avoids buying every RSI bounce in a global downtrend.
RSI + Stochastic
Two oscillators confirming each other - stronger but rarer signals.
- Long: RSI < 30 on 15m (period 14) AND Stochastic %K < 20 on the same 15m.
- Short: RSI > 70 AND Stochastic %K > 80.
- Alternative: group 1 - RSI cross up 30; group 2 - Stochastic cross up 20. Use OR between groups if you want more triggers.
RSI + Bollinger Bands
Momentum plus volatility - a classic mean-reversion combo.
- Long: RSI < 25 on 15m AND close below the lower BBands band (20, 2).
- Short: RSI > 75 AND price above the upper band.
- On 1h you can relax thresholds to RSI 30/70 - bands on a higher TF less often align with RSI extremes.
RSI 50 cross (trend momentum)
Level 50 is the rough boundary between bullish and bearish impulse over the period.
- Long: RSI crosses above 50 on 1h, period 14, check at close - start when buyers take control.
- Short: cross below 50 on 1h.
- To filter chop, require RSI on 4h already above 55 for Long or below 45 for Short.
Condition groups: practical example
A bot with two Long scenarios:
- Group 1: rsi_cross_up on 15m (30 up) AND RSI 4h > 50 - trend pullback.
- Group 2: rsi_value RSI < 20 on 15m AND Stochastic < 15 - aggressive counter-trend.
Groups are combined with OR: either scenario can start the bot. Configure Short symmetrically.
Tip
In a strong trend RSI can remain overbought (above 70) or oversold (below 30) for a long time. Counter-trend signals like “RSI > 70 → Short” or “RSI < 30 → Long” often start the bot against the main move. Add a higher-timeframe filter, the 50 level, or a trend indicator - and always respect grid risk management.