
The Start Bots Signal category describes signals and indicators that can start a trading bot. One of the technical indicators is KDJ.
When creating or editing any bot, there is a Start signal builder block at the bottom of settings. You can choose individual indicators, ready-made presets, and their combinations. Conditions are grouped: AND inside a group, OR between groups. The same indicator can be configured in different ways - for Long and Short, for breakouts and bounces, for level comparisons and for crosses.
What is KDJ
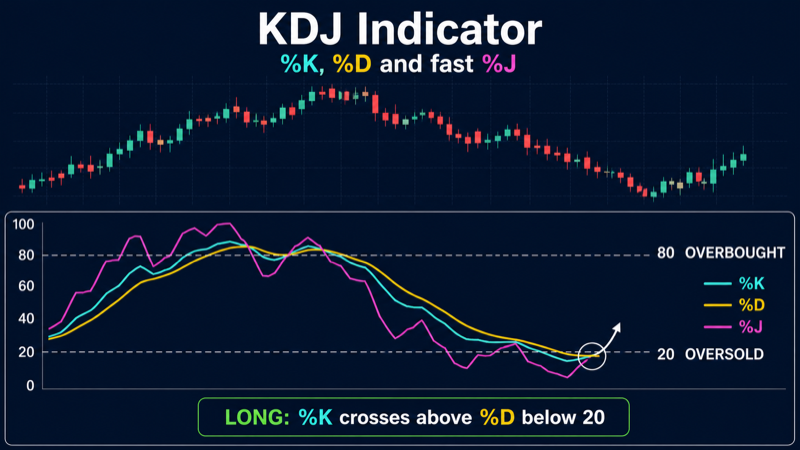
KDJ is a momentum oscillator developed as an extension of the classic Stochastic Oscillator. The indicator has three lines on an approximate 0–100 scale (line J can move outside these bounds): K is the fast line, D is the signal line (smoothed K), and J is the amplified line with formula 3K − 2D, reacting to changes faster than both.
KDJ shows where the current closing price sits within the High–Low range over the selected period and how momentum is changing. Classic levels: below 20 - oversold (Long potential), above 80 - overbought (Short potential). In the ELIXOAI start signal builder, KDJ is used as an automatic bot start condition - on crosses of 20/80 levels or K and D lines.
The J line amplifies K and D signals: it turns earlier but produces more noise. That is why builder presets default to valueK as the main working line. KDJ works well in ranges and on bounces, but in strong trends it can stay above 80 or below 20 for a long time - combine it with a trend filter.
KDJ vs Stochastic and RSI
All three oscillators relate to momentum, but measure it differently:
- Stochastic shows where the closing price sits within the High–Low range over a period. The %K and %D lines are classics for oversold/overbought and crosses. KDJ is built on the same RSV logic but adds the J line and often uses different smoothing parameters.
- RSI compares average price gains and losses and normalizes the result to 0–100. It answers “how strong was the price move,” not “where price sits in the High–Low channel.” Levels 30/70 mark oversold and overbought.
- KDJ is “Stochastic plus J”: three K/D/J lines instead of two %K/%D lines. K crossing above D (kdj_signal_cross) mirrors the classic Stochastic “golden cross”; K crossing above 20 (kdj_oversold_exit) is a conservative Long after oversold. The J line gives early signals but needs filtering.
How KDJ works
KDJ is calculated in several steps - from the price range to three lines:
- First, RSV (Raw Stochastic Value) is computed: how close the closing price is to the top of the High–Low range over period candles (default 14). RSV oscillates from 0 to 100.
- K is smoothed RSV (moving average over signal periods, default 3). D is a smoothed version of K over the same signal period. D is the “slow” signal line for crosses.
- J = 3K − 2D is the amplified line that leads K and D. J can drop below 0 or rise above 100 - that is normal and indicates extreme momentum.
In the builder you set a comparison condition on valueK, valueD, or valueJ: “valueK crosses above 20,” “valueK crosses above valueD,” “valueJ greater than 100,” and so on. The system fetches live values from the exchange via TAAPI and checks the condition on your timeframe - at candle close or every minute.
Three KDJ outputs
The builder exposes three numeric KDJ outputs:
- valueK (K): the fast line - main output for both presets. Used in kdj_oversold_exit (cross up 20) and kdj_signal_cross (cross up valueD). Reacts faster than D.
- valueD (D): the signal line - smoothed K. Acts as the cross target in kdj_signal_cross; can be set as the main output for gt/lt filters.
- valueJ (J): the amplified line (3K − 2D) - the most sensitive. Can move outside 0–100; suited for early reversal signals but produces more false triggers without a filter.
When valueK > valueD, bullish KDJ momentum dominates; when valueK < valueD, bearish momentum dominates. K crossing above D is a classic bullish signal; J leads both lines on sharp reversals.
Parameters: period 14, signal 3
- period: main RSV calculation period - how many candles define the High–Low range. Range 1–300, default 14. A longer period smooths KDJ, fewer false signals, but later entries.
- signal: smoothing period for K and D lines. Range 1–100, default 3. Lower signal - K and D react faster, more crosses and noise.
Settings 14/3 work well on 15m–1h. For 5m scalping, reduce period to 9 and signal to 2; for 4h swing, keep 14/3 or increase period to 21.
Ready-made presets in the builder
The builder offers two KDJ presets with default settings. Each can be fully customized: different operator, level, output, parameters, or timeframe.
kdj_oversold_exit - valueK cross up 20 (oversold exit)
Default condition: valueK crosses level 20 from below to above (cross up) on the selected timeframe (15m interval, parameters period 14 / signal 3, check at bar close).
A Long signal on oversold exit: K was below 20 and rose above - momentum began turning up after falling into the lower part of the range. More conservative than “valueK < 20.” For Short, set cross down 80.
kdj_signal_cross - valueK cross up valueD (momentum signal)
Default condition: valueK crosses valueD from below to above (cross up) on 15m, parameters 14/3, check at bar close.
A momentum signal: fast line K overtakes signal line D - bullish impulse strengthens. Works best with 20/80 levels or a trend filter; crosses in the middle of the range (40–60) often produce noise. For Short - valueK cross down valueD.
Available operators- Crosses above (cross up): valueK was below the level (or valueD) and moved above. Classic Long setup - cross up 20 or cross up valueD.
- Crosses below (cross down): valueK was above the level (or valueD) and dropped below. Short signal - cross down 80 or cross down valueD.
- Greater than (gt): Selected output is strictly above the level. E.g. valueK > 50 - bullish context without requiring a fresh cross.
- Less than (lt): Selected output is strictly below the level. valueK < 20 - oversold zone, useful for Long filters.
- Greater or equal (gte): Output is at or above the threshold. Handy for “valueK ≥ 50” filter on a higher timeframe.
- Less or equal (lte): Output is at or below the threshold. Bearish context filter: valueK ≤ 80 on 4h.
Like Stochastic, KDJ uses classic levels 20 (oversold) and 80 (overbought). The kdj_oversold_exit preset uses cross up 20 - exiting oversold. For Short symmetrically: cross down 80. Line J can move below 0 or above 100 - thresholds 0/100 are sometimes more informative for J, but valueJ is not used in presets by default.
General builder settings
- Timeframe (interval): 1m, 5m, 15m, 30m, 1h, 4h, 1d. Shorter intervals give more signals but more noise. Swing bots often use 1h–4h; scalping uses 5m–15m.
- Check mode: At candle close checks after the candle closes - fewer false triggers. Every minute checks inside the current candle - faster reaction, higher false-start risk.
- Operator: greater than, less than, crosses above, crosses below, greater or equal, and others define how the indicator value is compared to the target.
- Target value: a number (e.g. 30 for RSI), an indicator line (e.g. %D for Stochastic), or price (for Bollinger Bands).
- Condition groups: up to 3 groups with up to 5 conditions each. Example: group 1 - RSI < 30 AND price < lower band; group 2 - Stochastic < 20. The bot starts if group 1 OR group 2 is satisfied.
Setup examples for different strategies
Scalping: kdj_signal_cross on 5m–15m
Goal: frequent starts on short impulses.
Long: kdj_signal_cross preset, valueK cross up valueD, 5m timeframe, period 9 / signal 2, check at bar close.
Short: valueK cross down valueD, same settings.
Filter: valueK < 30 in the same group - crosses only in the lower range.
Swing: kdj_oversold_exit on 1h–4h
Goal: fewer but more meaningful bounces.
Long: valueK cross up 20 on 4h, period 14 / signal 3, check at close - bot starts on KDJ oversold exit on higher TF.
Short: valueK cross down 80 on 4h.
On 4h signals are rarer but closer to a sustained momentum reversal.
Trend confirmation
Goal: Long only when KDJ and trend align.
Group 1: kdj_oversold_exit (valueK cross up 20) on 15m AND close price above EMA 50 on the same 15m.
Short: valueK cross down 80 AND price below EMA 50.
EMA shows direction; KDJ confirms momentum is turning.
Oversold exit vs K/D cross
Goal: two entry types on one instrument.
Group 1 (conservative): kdj_oversold_exit - valueK cross up 20 on 15m.
Group 2 (momentum): kdj_signal_cross - valueK cross up valueD on 15m + valueK < 40.
OR logic: either scenario can start the bot.
KDJ + EMA
Long: price cross up EMA 20 on 15m AND kdj_oversold_exit (valueK cross up 20) on the same 15m - double confirmation.
Short: price cross down EMA 20 AND valueK cross down 80.
Alternative: valueK > 50 on 1h AND price > EMA 50 - trend Long.
Short on overbought
Condition: valueK cross down 80 or valueK cross down valueD, period 14 / signal 3, 15m, check at close.
Filter: RSI > 65 in the same group - short after overbought with fading KDJ momentum confirmation.
Fits short grids at local peaks.
J line for early signal
Long: valueJ cross up 0 on 15m (period 14 / signal 3) AND valueK < 25 - J leads K/D on reversal from deep oversold.
Short: valueJ cross down 100 AND valueK > 75.
J is more sensitive - use only with an extra filter (EMA or RSI).
Pullback in trend
Group 1: valueK on 4h greater than 50 AND kdj_oversold_exit (valueK cross up 20) on 15m.
Logic: higher TF shows sustained bullish momentum; lower TF catches resumption after a short correction.
KDJ + RSI
Long: RSI cross up 30 on 15m AND kdj_signal_cross (valueK cross up valueD) on 15m - two oscillators aligned.
Short: RSI cross down 70 AND valueK cross down valueD.
RSI catches oversold/overbought; KDJ provides a momentum signal via K/D lines.
Multi-timeframe
Long: valueK on 4h ≥ 50 (separate condition, gte) AND kdj_oversold_exit (valueK cross up 20) on 15m.
Short: valueK 4h ≤ 50 AND valueK cross down 80 on 15m.
This avoids buying every local KDJ bounce against global bearish momentum.
DCA on pullback
Long: kdj_oversold_exit (valueK cross up 20) on 1h AND RSI < 45 on 1h - KDJ bounce from weakness without extreme RSI oversold.
Short: valueK cross down 80 AND RSI > 55.
For a DCA bot, cross up 20 is softer than strict RSI < 30.
Condition groups: practical example
Bot with two Long scenarios:
Group 1: kdj_oversold_exit on 15m AND price > EMA 50 - trend momentum resumption.
Group 2: kdj_signal_cross on 15m + valueK < 35 AND RSI < 40 - momentum bounce with confirmation.
Groups combined with OR. Configure Short symmetrically (cross down 80, valueK cross down valueD).
Tip
Like Stochastic, KDJ often oscillates around the middle of the range in chop: cross up 20 and K/D crosses trigger frequently. Increase period (21 instead of 14), add an EMA filter, or require valueK ≥ 50 on a higher timeframe. The J line leads K/D - use it only with confirmation. Check at bar close reduces intrabar noise.