
Na categoria Start Bots Signal ficam as descrições de sinais e indicadores que podem iniciar um bot de trading. Um dos indicadores técnicos é Ichimoku.
Ao criar e editar qualquer bot, existe um bloco Construtor de sinais de início na parte inferior das configurações. Nele você pode escolher indicadores individuais, presets prontos e suas combinações. As condições são agrupadas: E dentro do grupo, OU entre grupos. O mesmo indicador pode ser configurado de formas diferentes - para Long e Short, para rompimentos e repiques, para comparar com um nível ou para cruzamentos.
O que é Ichimoku
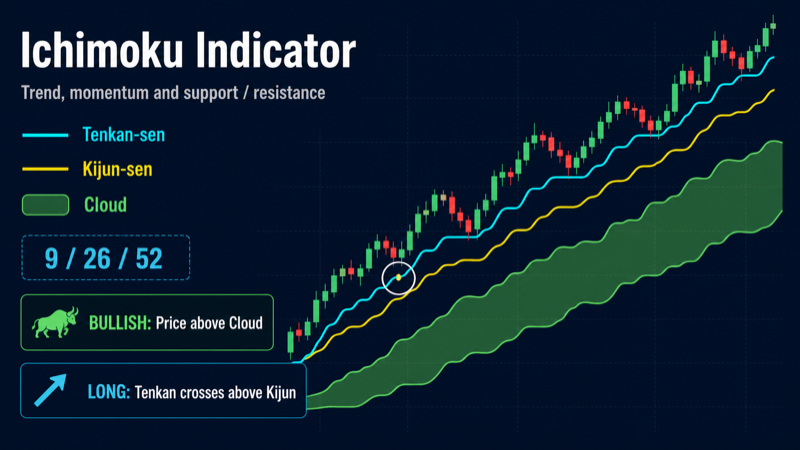
Ichimoku Kinko Hyo («gráfico de equilíbrio num relance») é um indicador de tendência japonês que mostra direção, impulso e zonas de suporte/resistência numa tela. O construtor de sinais ELIXOAI oferece quatro presets baseados no indicador TAAPI ichimoku.
Elementos-chave: Tenkan-sen (conversion) - linha rápida, média de high/low em 9 períodos; Kijun-sen (base) - linha lenta de 26 períodos; nuvem Kumo - área entre Span A e Span B, deslocada 26 velas. Nuvem de alta - Span A acima de Span B; de baixa - o oposto. Preço acima da nuvem = contexto de alta, abaixo de baixa, dentro incerteza.
Ichimoku funciona como sistema de filtros: rompimento acima do Kumo top confirma compradores, cruzamento Tenkan/Kijun captura impulso local, mudança de cor da nuvem marca virada de médio prazo. Em lateral há muito ruído - combine presets ou filtros em timeframe superior.
Ichimoku vs EMA and MACD
Ichimoku overlaps with other trend tools but gives a more complete picture:
- EMA - a single moving average of close. Ichimoku uses high/low averages (Tenkan, Kijun) and builds a zone (the cloud), not one line. EMA is easier to tune but does not show support/resistance “thickness”.
- MACD - difference of two EMAs, a momentum oscillator. Ichimoku also has fast/slow lines (Tenkan/Kijun), but TK cross is only one of four presets; the main filter is price vs Kumo.
- Ichimoku combines trend, impulse, and levels: Kumo top/bottom are dynamic cloud boundaries; currentSpanA/B are live boundaries without displacement. In ELIXOAI each component is available as an output for custom conditions.
Como o Ichimoku funciona
Standard calculation (TAAPI defaults):
- Tenkan (conversion) = (max high + min low) / 2 over conversionPeriod (9). Fast line, reacts to local extremes.
- Kijun (base) = (max high + min low) / 2 over basePeriod (26). Slow line; price above Kijun - bullish bias, below - bearish.
- Span A = (Tenkan + Kijun) / 2, shifted displacement (26) bars forward. Span B = (max high + min low) / 2 over spanPeriod (52), also shifted.
- Kumo (cloud) - zone between Span A and Span B. currentSpanA/B - values without shift (current cloud on chart). max(currentSpanA, currentSpanB) - cloud top (Kumo top), min(...) - bottom (Kumo bottom).
In the builder you pick a preset or build a condition manually: compare an output to price, another output, or a level. The system fetches Ichimoku values via TAAPI and checks the condition on your timeframe - at candle close or every minute.
Outputs disponíveis
The ichimoku indicator returns these values:
- conversion (Tenkan): fast line; used in the cruzamento Tenkan/Kijun preset.
- base (Kijun): slow line; cross target for Tenkan or trend filter.
- spanA: cloud Span A (shifted); compared to spanB in cloud color preset.
- spanB: cloud Span B (shifted); slow Kumo boundary.
- currentSpanA: live Span A without shift - the “current” cloud on the bar.
- currentSpanB: live Span B without shift.
- max(currentSpanA, currentSpanB) - Kumo top: upper cloud boundary; ichimoku_kumo_breakout_up uses price cross up through it.
- min(currentSpanA, currentSpanB) - Kumo bottom: lower cloud boundary; ichimoku_kumo_breakout_down uses price cross down through it.
Parâmetros Ichimoku
- conversionPeriod (Tenkan): default 9, range 1–300. Lower - more sensitive Tenkan and more TK crosses.
- basePeriod (Kijun): default 26, range 1–300. Classic 9/26 ratio for 15m–1h.
- spanPeriod (Span B): default 52, range 1–500. Sets cloud “thickness” and slowness.
- displacement: default 26, range 1–300. Forward shift of Span A/B; currentSpanA/B have no shift.
Standard 9/26/52/26 is Hosoda’s daily setting. On crypto 15m–4h defaults often stay; for 5m scalping you may scale periods down proportionally (e.g. 5/13/26/13) - backtest first.
Presets prontos no construtor
The builder offers four Ichimoku presets with defaults (15m, check at bar close, parameters 9/26/52/26). Each is fully customizable: different operator, timeframe, or output.
ichimoku_kumo_breakout_up - rompimento da nuvem para cima
Condição padrão: max(currentSpanA, currentSpanB) (Kumo top) crosses price from below to above (cross up) on 15m.
Long signal: price breaks above the cloud top - exit from uncertainty or bearish context. Stronger if the cloud is already bullish (Span A > Span B) or Tenkan is above Kijun. For Short use ichimoku_kumo_breakout_down.
ichimoku_kumo_breakout_down - rompimento da nuvem para baixo
Condição padrão: min(currentSpanA, currentSpanB) (Kumo bottom) crosses price from above to below (cross down) on 15m.
Short signal: price falls below Kumo bottom - loss of bullish structure. More effective with bearish cloud and Tenkan below Kijun. Combine with RSI > 60 for shorts from overbought.
ichimoku_cloud_color - nuvem de alta
Condição padrão: spanA crosses spanB from below to above (cross up) on 15m - cloud turns bullish.
Medium-term trend shift: Span A rises above Span B - buyers dominate cloud structure. For bearish cloud set cross down. Often used as a filter with kumo_breakout_up, not as the only condition.
ichimoku_tenkan_kijun - cruzamento Tenkan/Kijun
Condição padrão: conversion (Tenkan) crosses base (Kijun) from below to above (cross up) on 15m.
Classic “TK cross”: fast line overtakes slow - local upward impulse. Short-term golden cross analogue. For Short - cross down. Many false signals in ranges; add “price above Kumo top” or nuvem de alta filter.
Operadores disponíveis- Cruza para cima (cross up): left output was below right and moved above. Main Long operator for all four presets.
- Cruza para baixo (cross down): left output was above and dropped below. Short versions of presets.
- Maior que (gt): e.g. price gt Kumo top - sustained above cloud without fresh breakout.
- Menor que (lt): price lt Kumo bottom - bearish context, Short filter.
- Greater or equal (gte): Tenkan gte Kijun - bullish bias without a cross.
- Less or equal (lte): Tenkan lte Kijun - bearish bias on higher TF as filter.
Configurações gerais do construtor
- Timeframe (intervalo): 1m, 5m, 15m, 30m, 1h, 4h, 1d. Intervalos menores geram mais sinais, porém mais ruído. Bots swing costumam usar 1h–4h; scalping usa 5m–15m.
- Modo de verificação: No fechamento da vela - verificação após o fechamento, menos disparos falsos. A cada minuto - verificação dentro da vela atual, reação mais rápida, maior risco de início falso.
- Operador: maior, menor, cruza para cima/baixo, maior ou igual etc. definem como o valor do indicador é comparado ao alvo.
- Valor alvo: número (ex.: 30 no RSI), linha do indicador (ex.: %D no Stochastic) ou preço (no Bollinger Bands).
- Grupos de condições: até 3 grupos com até 5 condições cada. Exemplo: grupo 1 - RSI < 30 E preço < banda inferior; grupo 2 - Stochastic < 20. O bot inicia se o grupo 1 OU o grupo 2 for atendido.
Exemplos de configuração para diferentes estratégias
Kumo breakout up - classic Long
Objetivo: start when price exits above the cloud.
Long: preset ichimoku_kumo_breakout_up, 15m, check at close.
Filtro: ichimoku_cloud_color cross up on same 15m OR price already gt Kumo top on 4h.
Strong trend scenario after consolidation inside or below the cloud.
Kumo breakout down - Short
Short: preset ichimoku_kumo_breakout_down, 15m, Kumo bottom cross down vs price.
Filtro: spanA cross down spanB (bearish cloud) on 1h.
Fits short grids when higher-TF bullish structure breaks down.
Bullish cloud + price above Kumo
Long: ichimoku_cloud_color cross up (spanA cross up spanB) on 1h AND price gt max(currentSpanA, currentSpanB) on 15m.
Lógica: medium-term trend turned; lower TF confirms hold above cloud. Fewer false entries than TK cross alone.
cruzamento Tenkan/Kijun - impulse Long
Long: ichimoku_tenkan_kijun (conversion cross up base) on 15m.
Filtro: price gt Kijun (base) on same 15m - TK cross only in bullish half of chart.
Short: conversion cross down base AND price lt Kijun.
Kumo breakout + cloud confirmation
Grupo 1: ichimoku_kumo_breakout_up on 15m AND ichimoku_cloud_color - spanA gt spanB (gte) on 15m.
Lógica: Kumo top break with already nuvem de alta - double strength confirmation. One of the most conservative Ichimoku Long setups.
Pullback to cloud
Long: on 4h price gt Kumo top (separate gt condition) AND on 15m ichimoku_tenkan_kijun cross up after pullback to Kijun.
Lógica: higher TF bullish trend; lower TF catches resumption from Kijun or cloud top support.
Scalping: TK cross on 5m
Long: ichimoku_tenkan_kijun cross up on 5m, conversionPeriod 9, basePeriod 26.
Filtro: on 15m price gt Kumo bottom (min currentSpan) - avoid shorting structure inside bearish cloud.
Frequent signals; higher-TF or nuvem de alta filter required.
Swing: Kumo breakout on 4h
Long: ichimoku_kumo_breakout_up on 4h, parameters 9/26/52/26, check at close.
Short: ichimoku_kumo_breakout_down on 4h.
Rare but meaningful signals - suited for swing bots with wide stops and DCA.
Short: bearish cloud + breakdown
Short: ichimoku_cloud_color cross down on 1h AND ichimoku_kumo_breakout_down on 15m.
Alternative: Tenkan cross down Kijun on 15m AND price lt Kumo bottom.
Symmetric bearish version of trend presets.
Multi-timeframe
Long: on 4h spanA gt spanB (nuvem de alta) AND ichimoku_kumo_breakout_up on 15m.
Short: spanA lt spanB on 4h AND kumo_breakout_down on 15m.
Global cloud context + local breakout trigger - classic Ichimoku MTF.
DCA at Kumo bottom
Long: price cross up min(currentSpanA, currentSpanB) on 1h (bounce from Kumo bottom) AND ichimoku_tenkan_kijun cross up on 15m.
Filtro: spanA gt spanB on 1h - DCA only in nuvem de alta on pullbacks to support.
Ichimoku + RSI
Long: ichimoku_kumo_breakout_up on 15m AND RSI cross up 40 on 15m - cloud break without extreme overbought.
Short: kumo_breakout_down AND RSI cross down 60.
RSI filters breakouts on exhausted moves.
Grupos de condições: exemplo prático
Bot with two Long scenarios:
Grupo 1: ichimoku_kumo_breakout_up on 15m AND ichimoku_cloud_color cross up on 1h - breakout with nuvem de alta.
Grupo 2: ichimoku_tenkan_kijun cross up on 15m AND price gt Kumo top on 4h - TK cross in global uptrend.
Groups combined with OR. Configure Short symmetrically (kumo_breakout_down, TK cross down, bearish cloud).
Dica
Ichimoku é um sistema, not one signal: in ranges TK cross and cloud color flip often. Use Kumo breakout on a higher TF as filter for lower presets. A “thick” cloud (Span A far from Span B) is strong support/resistance; thin cloud breaks easier. Check at bar close reduces false Kumo breaks on intrabar noise. All four presets cover different trend facets - combine them rather than relying on one.